| | Watching Watchlist #7 2025
This is a watchlist composed of the current stocks we are looking to trade none of these are alerts, all alerts will be alerted upon entry just like the others on the weekly investment letter. |
| | | | Company: Zevia PBC
Quote: $ZVIA
BT: $1.50 -$2.00
ST: $4 (no buy out), $8+ if we see M&A action
Sharks Opinion: Zevia is a name I’ve become familiar with over the past year not through the markets, but as a regular buyer of their zero-sugar sodas at Costco.
It wasn’t until recently, following a massive earnings beat, that I realized the brand was publicly traded. Since that report, ZVIA shares are up 38.2%, currently trading at $2.82.
For long-time members of Stock Sharks, you know we’ve had a consistent focus on the beverage sector — particularly because of its history of high-profile M&A activity. Legacy giants like Coca-Cola and PepsiCo routinely acquire fast-growing upstarts to secure dominance on retail shelves. Just last quarter, PepsiCo acquired Poppi in a multi-billion-dollar deal — a reminder that if a brand gains enough traction, it doesn’t stay independent for long.
Zevia went public during the pandemic, debuting around $13 per share with a valuation near $1 billion. Since then, the stock has dropped more than 73%, creating what we see as a high-risk, high-reward setup. While a full return to IPO pricing is unlikely under organic growth alone, a strategic acquisition by a major beverage conglomerate could bridge that gap quickly.
This is a speculative swing trade, grounded in the belief that Zevia will continue expanding its distribution channels, build brand equity, and ultimately position itself as a compelling takeout target. We acknowledge the risks — the beverage space is brutally competitive, and execution will be key but the asymmetric upside if a buyer steps in is what makes this trade worth a closer look.
We’re watching closely for signals around distribution growth, retail partnerships, and revenue scaling — all of which could validate the M&A angle.
Description: Zevia PBC develops, markets, sells, and distributes zero sugar beverages in the United States and Canada. The company offers soda, energy drinks, and organic tea under the Zevia brand name. It serves grocery distributors; national, convenience, natural products, and warehouse club retailers; and retailers through a network of grocery, food, drug, warehouse club, mass, natural, convenience, and e-commerce channels, as well as natural product stores and specialty outlets. The company was founded in 2007 and is headquartered in Encino, California. | | |  |
Zevia PBC positions itself as a better-for-you beverage company, with a product lineup that spans sodas, energy drinks, and teas all sweetened exclusively with stevia, a natural, zero-calorie alternative to sugar and artificial sweeteners.
As the only major beverage brand offering carbonated drinks entirely sweetened by stevia, Zevia holds a unique spot in the marketplace. This distinct positioning could serve as a powerful moat over time, particularly as consumer demand continues to shift toward clean-label, health-conscious alternatives.
Unlike traditional sweeteners such as aspartame, which have come under increasing scrutiny for potential health risks including links to cancer and cognitive issues, according to bodies like the International Agency for Research on Cancer stevia is widely regarded as a safer, plant-derived alternative. With growing public awareness of these concerns, Zevia’s stevia-first formula offers a compelling value proposition.
From personal experience as both a Zevia and diet soda consumer, I’d estimate Zevia’s sodas taste 20–30% better than traditional diet drinks, with no lingering artificial aftertaste. That subjective edge, combined with a cleaner health profile, could give Zevia a durable advantage in attracting and retaining health-conscious customers.
Zevia’s continued success on major retail shelves including Walmart and Costco reinforces its mainstream appeal. As the brand scales further and expands its presence across additional retail and e-commerce channels, the foundation for long-term growth becomes increasingly credible.
Zevia is still in the early innings of its public company journey, but its differentiated product strategy, alignment with long-term health trends, and growing distribution footprint all point toward meaningful upside. For investors looking for exposure to the next wave of health-driven beverage innovation, ZVIA is worth a closer look.
| 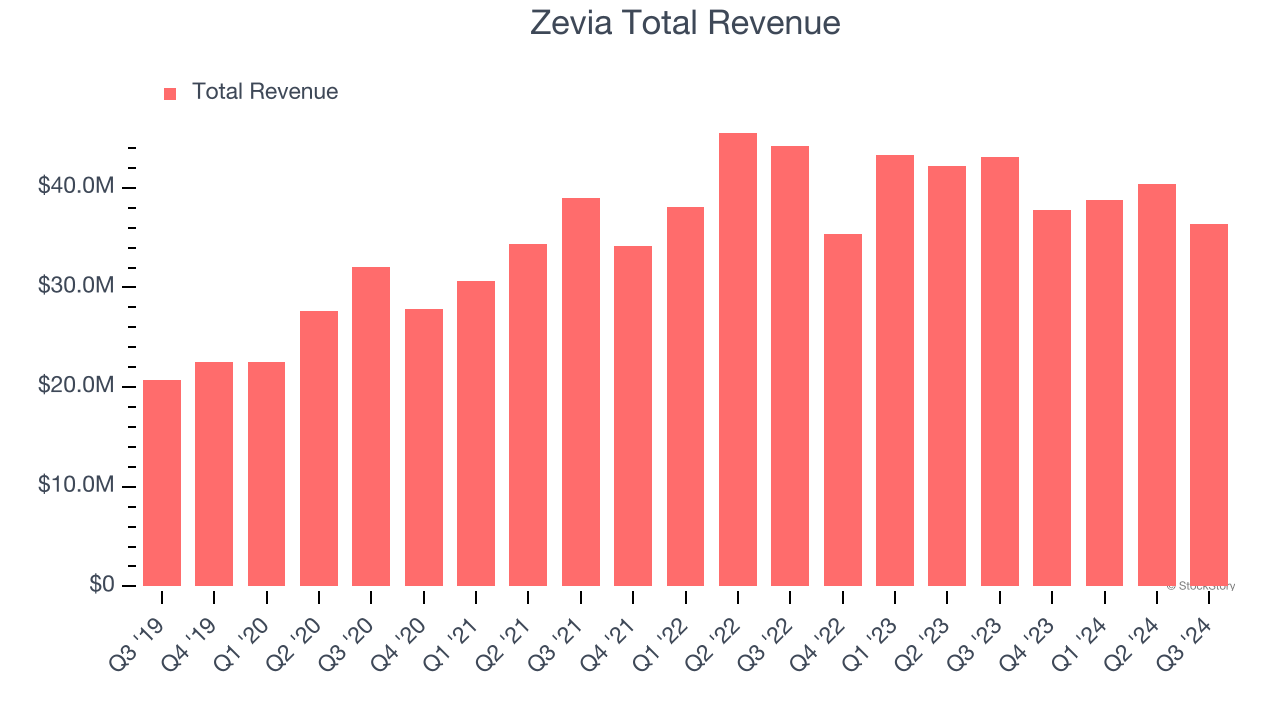 |
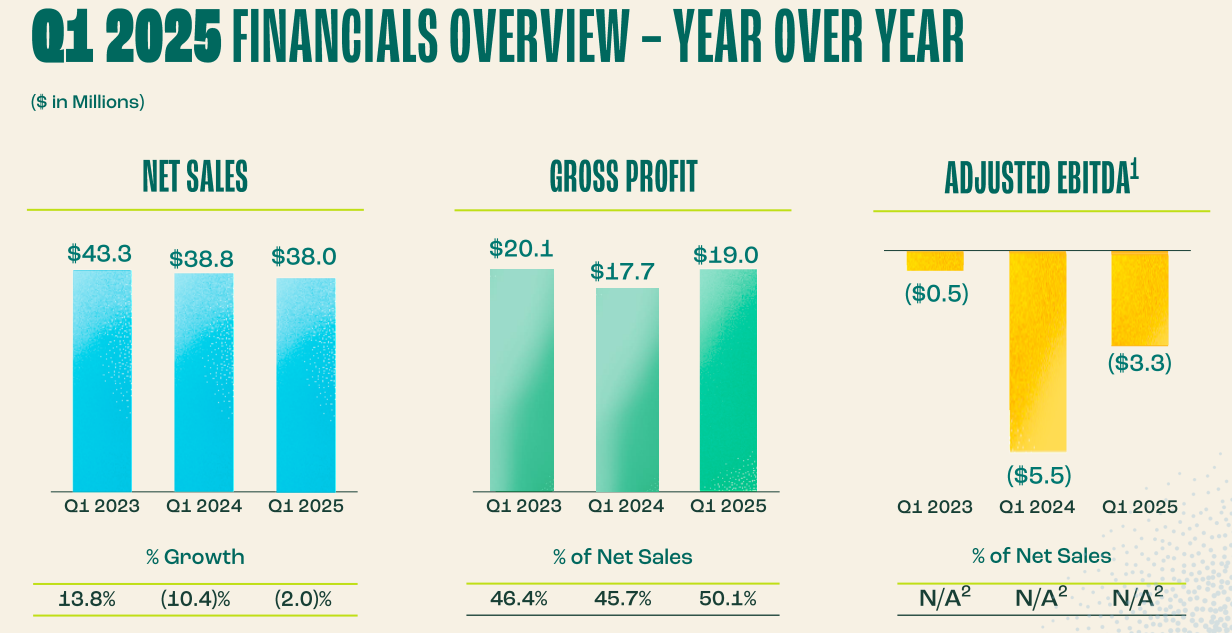
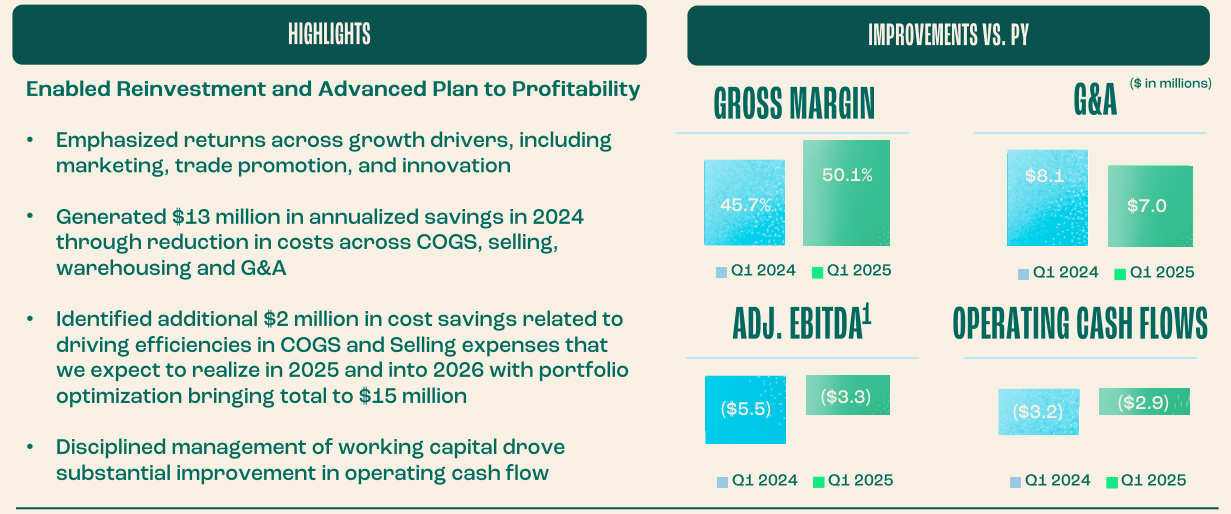
Zevia (ZVIA) delivered a strong first quarter for calendar year 2025, exceeding expectations on revenue, earnings, and profitability, even as top-line growth declined slightly. The results point to improving operational efficiency and disciplined execution in a competitive and cost-sensitive consumer packaged goods environment.
Key Financial Highlights
Revenue: $38.02 million vs. $37.38 million consensus Beat estimates by 1.7%, though down 2.0% YoY Decline driven by higher promotional activity, partially offset by expanded Walmart distribution and a 0.1% volume increase GAAP EPS: -$0.08 vs. -$0.12 expected (31% beat) Adjusted EBITDA: -$3.27 million vs. -$5.9 million expected 44.6% beat with EBITDA margin improving to -8.6% Operating Margin: -16.8%, up 200 bps from -18.8% in Q1 2024 Free Cash Flow: -$2.94 million vs. -$3.24 million YoY Showing gradual improvement toward breakeven Gross Margin: 50.1%, up 440 bps YoY Driven by lower product costs and improved inventory management Partially offset by higher promotional spend
Expense Breakdown
Selling & Marketing Expenses: $15.3 million (40.3% of net sales) Up from $15.1 million (38.8%) in Q1 2024 Marketing Spend: $6.2 million (16.2% of net sales) Up significantly from $2.7 million (7.0%) last year Reflects increased brand-building and awareness campaigns Selling Expenses: $9.1 million (24.1% of net sales) Down from $12.3 million (31.8%) last year Indicates enhanced sales efficiency and cost control
Balance Sheet & Outlook
Cash & Equivalents: $27.7 million Debt: None Credit Facility: $20 million available and unused Market Cap: $125.8 million The company reconfirmed full-year revenue guidance of $160.5 million (midpoint) and raised full-year EBITDA guidance to -$9.5 million, slightly above consensus expectations. | | | | | 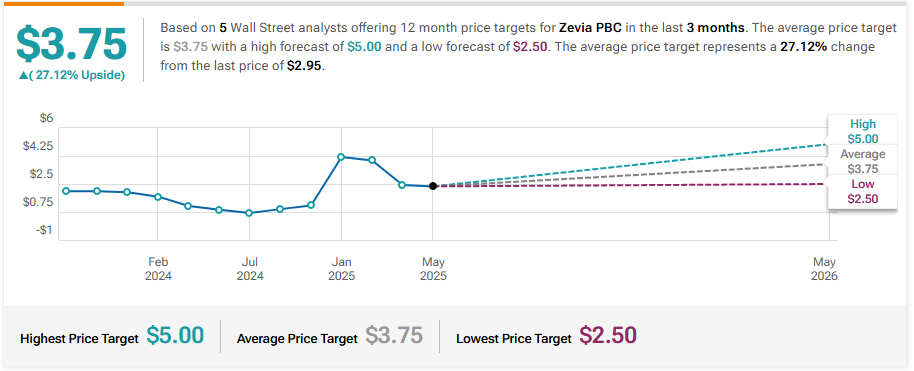 | Telsey Advisory Group Maintains Market Perform on Zevia, Maintains $3 Price Target
Goldman Sachs Maintains Neutral on Zevia, Raises Price Target to $3.75
Wells Fargo Maintains Equal-Weight on Zevia, Lowers Price Target to $1
Morgan Stanley Maintains Equal-Weight on Zevia, Lowers Price Target to $2
|  | | | Company: Topgolf Callaway Brands
Quote: $MODG
BT: $5.80 - $6.25
ST: $12-$17 (we will take what we can get)
Sharks Opinion:
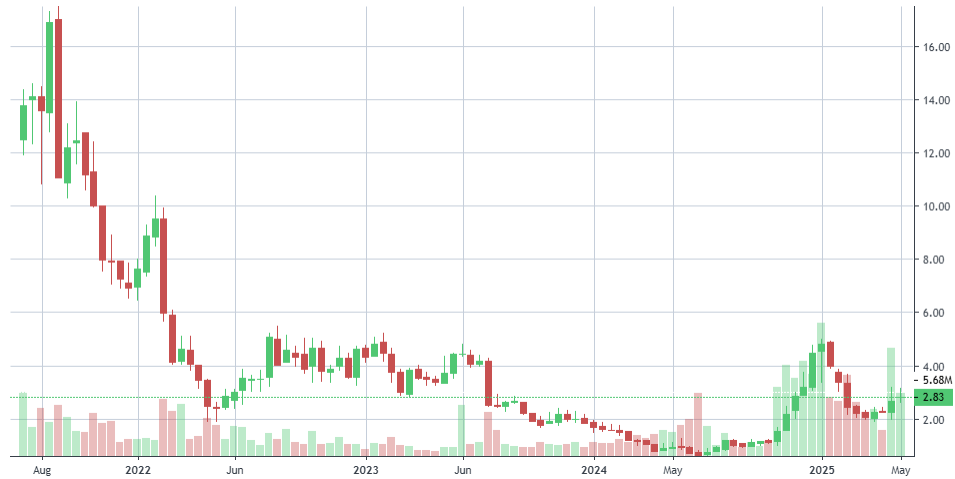
It’s summer, it’s golf season and in our view, Topgolf Callaway Brands is trading at a severe discount.
The stock has fallen dramatically from its mid-2021 highs in the $30s to recent lows below $10. While part of that decline reflects post-pandemic normalization, a larger factor has been the broader market’s disinterest in small caps and non-tech sectors.
But this underperformance now sets the stage for a potential rebound, especially with 2025 revenue and EBITDA growth projected, even in the face of a challenging consumer backdrop.
Recent company updates show low-single-digit growth in rounds played and on-course participation, contributing positively to revenue. An unexpected lift from advanced product shipments also helped support top-line strength.
On the cost side, management is forecasting margin improvements and overhead reductions across both Topgolf and legacy Callaway operations. These changes, combined with strategic cost-cutting and margin expansion initiatives, support a more favorable free cash flow outlook going into the back half of the year.
Seasonal Tailwind + Repricing Opportunity
We’re approaching MODG as a tactical summer swing trade, anchored in the seasonal strength of golf activity and the cyclical nature of the sport’s earnings trends. With sentiment at multi-year lows and operational momentum quietly building, the current price offers an asymmetric opportunity.
We’re also encouraged by a recent sum-of-the-parts valuation pegging fair value at $17.94 per share, representing a potential 95% upside from current levels.
MODG isn’t just a golf stock — it’s a restructuring and rebound play with seasonal tailwinds, undervalued fundamentals, and a possible catalyst in the form of better-than-expected next earnings. If the summer holds up — and if the company continues to execute — there’s room here to "cigar butt" a profitable swing before sentiment cools again.
Description: Topgolf Callaway Brands Corp. designs, manufactures, and sells golf equipment, golf and lifestyle apparel, and other accessories in the United States, Europe, Asia, and Internationally. It operates in three business segments: Topgolf, Golf Equipment, and Active Lifestyle. The Topgolf segment operates Topgolf venues equipped with technology-enabled hitting bays, bars, dining areas, and event spaces, as well as Toptracer ball-flight tracking technology. The Golf Equipment segment provides drivers, fairway woods, hybrids, irons, wedges and packaged sets, putters, and pre-owned golf clubs under the Callaway and Odyssey brands, and golf balls under the Callaway Golf and Strata brands. | | | 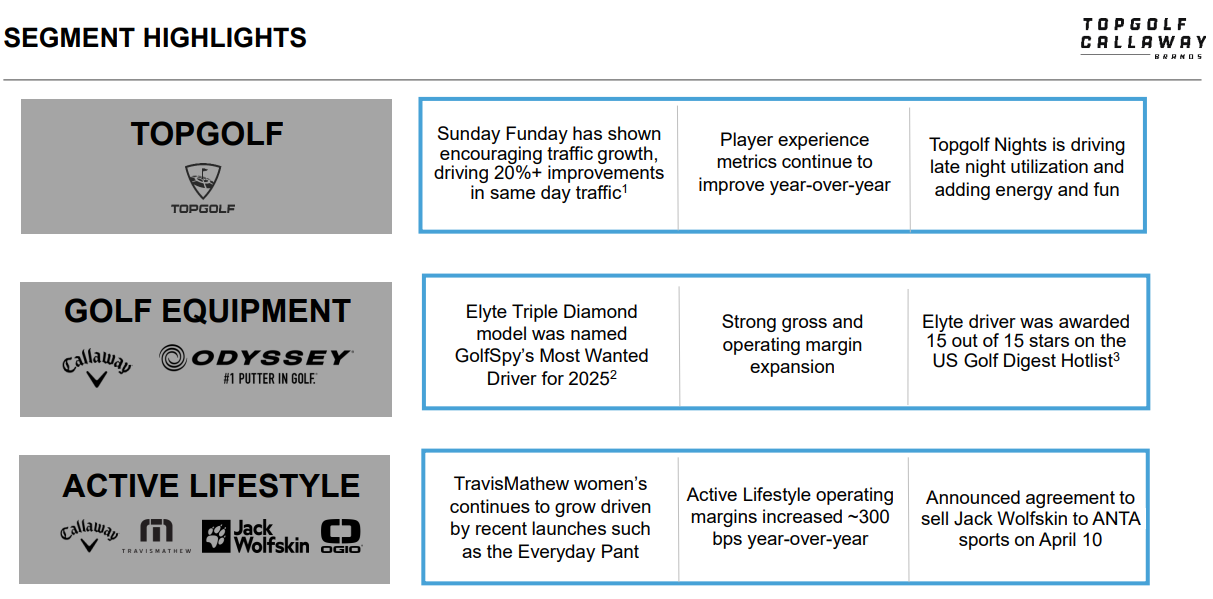 | Topgolf Callaway Brands operates across three distinct segments each with unique growth drivers and strategic value. Together, they form an underappreciated portfolio that could unlock substantial shareholder upside through operational execution, structural optimization, or strategic interest from private equity or activist investors.
1. Topgolf, The Social Engine of Golf’s Modern Era
Often dubbed the “bowling alley of golf,” Topgolf reimagines the sport as a social, tech-enabled experience where players hit microchipped golf balls at giant targets, all while enjoying food and drinks. The experience appeals to golfers and non-golfers alike, driving broad demographic adoption.
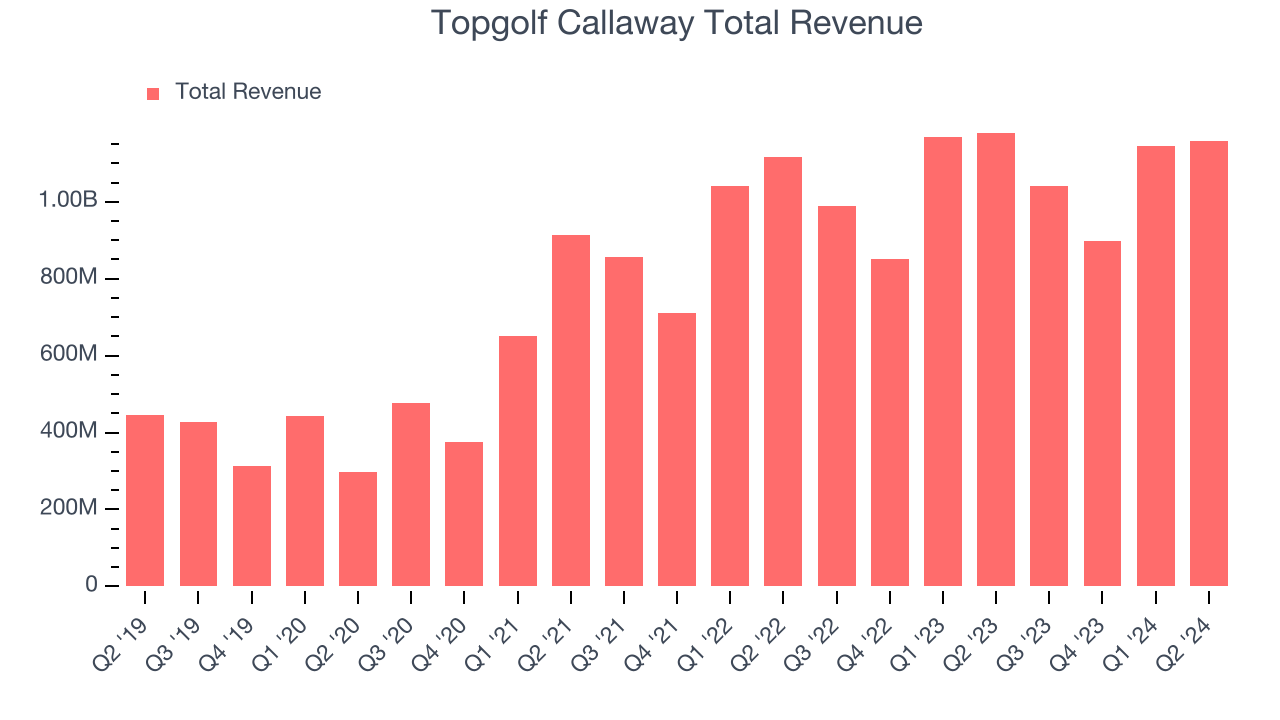
2024 Revenue: $1.8 billion Venue Count: 100+ domestic locations, with plans to open 11 new sites annually Long-Term Target: 250 owned venues + potential for 250 additional global franchises
Unit Economics: ~$30M per venue (largely landlord-financed) 40–50% cash-on-cash returns 2.3-year payback period 35% mature venue EBITDA margins These metrics are highly attractive to private equity buyers, and if separated from MODG’s consolidated structure, Topgolf alone could command a premium valuation as a standalone experiential entertainment company.
2. Callaway Golf —Category Leadership in Equipment
The Callaway segment represents MODG’s legacy business, anchored in golf’s most essential gear, clubs and balls. #1 in global golf clubs #2 in golf balls Annual Revenue: $1.3 billion+ Driven by continued participation growth in golf, particularly post-pandemic, and strong brand loyalty among serious players This business offers stable, recurring revenue, attractive gross margins, and acts as the core foundation of MODG’s balance sheet. As a standalone brand, it could be re-rated as a pure-play consumer discretionary name, particularly if Topgolf were spun out.
3. Active Lifestyle, A Turnaround Lever
The Active Lifestyle segment includes brands like Jack Wolfskin and TravisMathew, which offer growth potential but currently dilute MODG’s valuation. Management has signaled renewed focus on margin improvement and brand positioning in this segment, potentially unlocking incremental value over time.
Strategic Takeaway: Undervalued Asset, Ripe for Catalysts
MODG presents a classic sum-of-the-parts opportunity:
Topgolf could be spun off or attract private equity interest given its high-growth, cash-generative profile Callaway’s core equipment business merits a higher multiple as a steady, consumer-facing brand
Active Lifestyle remains a turnaround lever with optionality Activist investors or strategic buyers could push for structural changes to realize full value. With shares trading far below fair value estimates and clear paths to monetization, MODG is increasingly positioned as a breakout candidate in the consumer and leisure space.
|  | 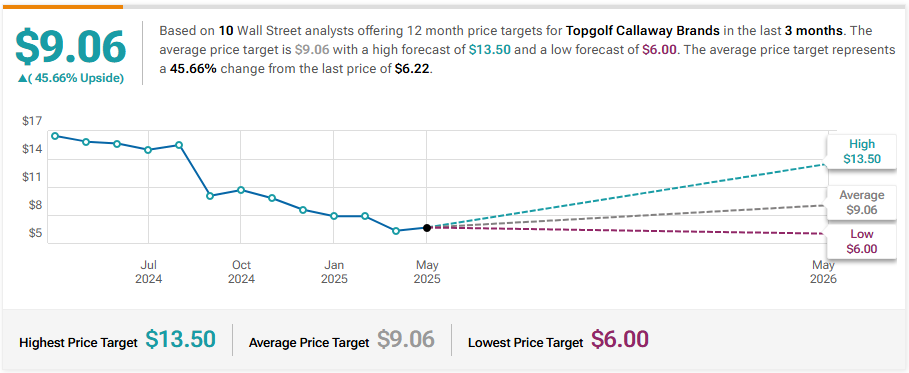 | Truist Securities Maintains Buy on Topgolf Callaway Brands, Lowers Price Target to $7
Roth MKM Reiterates Buy on Topgolf Callaway Brands, Lowers Price Target to $11
JP Morgan Maintains Neutral on Topgolf Callaway Brands, Lowers Price Target to $9
Jefferies Upgrades Topgolf Callaway Brands to Buy, Raises Price Target to $13
| 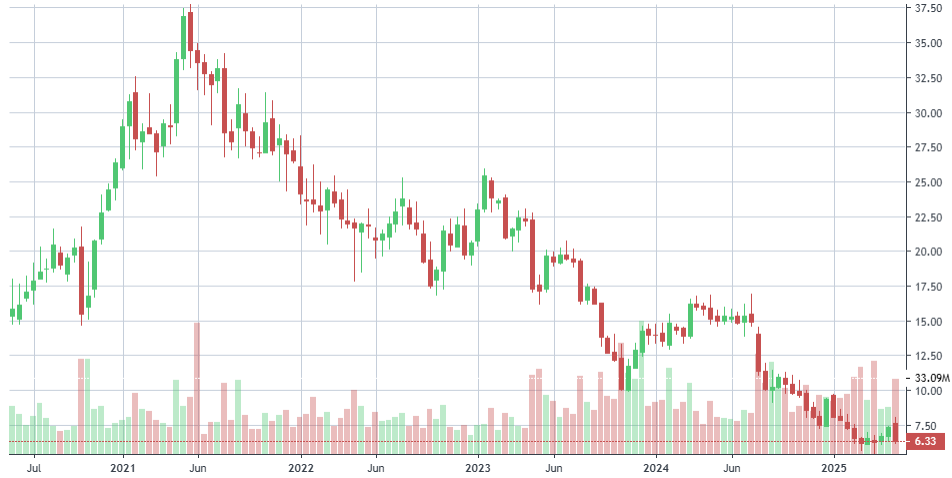 | | | Company: Block, Inc.
Quote: $XYZ
Sharks Opinion:
We’ve never been strong advocates of Block Inc. (formerly Square) since its inception. But after a steep selloff this year and a wave of institutional accumulation during the recent 13F filing season, the setup is increasingly difficult to ignore. When smart money flows, we pay attention — even if the name isn't one we’ve historically favored.
At present levels, Block resembles PayPal (PYPL) from recent years: a beaten-down fintech giant that risks becoming dead money if sentiment fails to turn.
However, with such a dramatic compression in valuation, there’s a case to be made for a potential rebound especially if management can execute through the competitive noise.
At its peak in late 2021, Block’s enterprise value reached $127 billion, trading at a hefty 28.8x gross profit based on $4.4 billion in earnings. Fast forward to today:
Enterprise Value: ~$29 billion 2024 Gross Profit: $8.9 billion EV/Gross Profit Multiple: 3.2x That’s a dramatic re-rating — and one that now presents a far more compelling risk/reward, at least from a fundamental standpoint.
Forward Outlook: Room for Repricing?
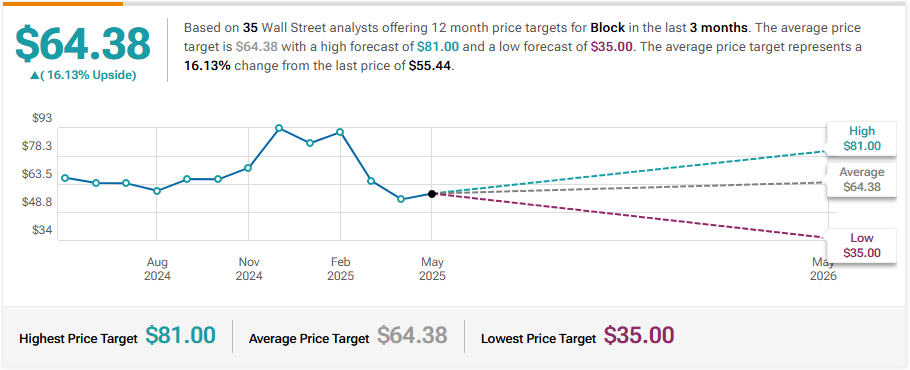
Block is guiding for $2.1 billion in adjusted operating income for 2025, with an expected 240-basis-point margin expansion. If the company can maintain that momentum amidst growing competition in the fintech space from names like Stripe, PayPal, and Apple a valuation re-rating is not out of the question. Some models place Block’s fair value around $126 per share, which represents meaningful upside from current levels. That kind of move would require consistent execution, margin discipline, and a stabilization of macro sentiment around consumer spending and digital payment adoption.
We remain cautious on Block’s long-term competitive positioning, but the math is starting to work in its favor. With the stock trading at a fraction of its former valuation, strong institutional buying, and clear margin improvement ahead, this is shaping up to be a reluctant but calculated swing trade — one where risk is defined and potential upside is increasingly attractive
BT: anything below $60 feels like a steal of a deal
ST: $120-$145
Description: Block, Inc., together with its subsidiaries, builds ecosystems focused on commerce and financial products and services in the United States and internationally. It operates through two segments: Square and Cash App. The Square segment offers commerce products for restaurants, appointments, retail, point of sale, online, online checkout, and invoices, as well as virtual terminals, risk and order managers, and payment and commerce application programming interfaces; managed payment services; software solutions; hardware products, such as registers, terminals, stands, and readers for contactless and chips; banking services consisting of lending, instant transfer, and checking and savings accounts; and full-service setup and support services. | | |  | Block Inc. refers to itself as an “ecosystem of ecosystems” a diversified fintech company operating across several interconnected platforms, each designed to serve different segments of the modern economy. While casual observers may see a loosely connected group of products, a closer look reveals a strategically integrated suite of services that leverage shared infrastructure, data, and user bases to drive long-term value.
Key Ecosystems Within Block
1. Square – The Merchant Commerce Engine
Square is Block’s original and most well-known business unit. It serves small to mid-sized merchants through a comprehensive commerce platform that combines hardware, software, and payments infrastructure.
Best suited for businesses with 1–20 locations Plug-and-play setup makes it easy for entrepreneurs and retailers to accept payments, manage inventory, and scale A self-service “general purpose stack” that enables merchants to get up and running quickly As Square scales, it builds a merchant-side network effect that deepens customer loyalty and unlocks recurring gross profit growth.
2. Cash App – Consumer Finance Super App Cash App is Block’s flagship consumer-facing platform — a mobile finance ecosystem that began as a peer-to-peer payment tool but has since expanded into: Direct deposit & payroll features Investing in stocks and Bitcoin Debit card functionality Tax filing tools This has transformed Cash App into a lightweight digital banking alternative, particularly for younger, underbanked users. The more users adopt these layered services, the more value Block extracts per user in the form of gross profit contribution.
3. Afterpay – Buy Now, Pay Later Expansion
Acquired for ~$14 billion, Afterpay is a Buy Now, Pay Later (BNPL) platform that Block has integrated into its ecosystem to: Serve merchants as an alternative payment option Expand customer acquisition channels Allow consumers to split payments and discover retailers that support the service BNPL remains a competitive and crowded field, but the integration with both Square and Cash App creates strategic advantages that standalone BNPL players lack.
4. Tidal – The Outlier, with Brand-Driven Potential
In 2021, Block acquired Tidal, a music streaming platform, for $297 million. While not core to Block’s fintech identity, the acquisition was likely driven by: A desire to diversify platform engagement Opportunities to empower artists through direct-to-fan monetization Long-term potential to integrate creator economy tools into Cash App and Square Though still largely experimental, Tidal reflects Block’s ambition to expand beyond traditional financial services.
Strategic Flywheel: Ecosystems That Reinforce Each Other
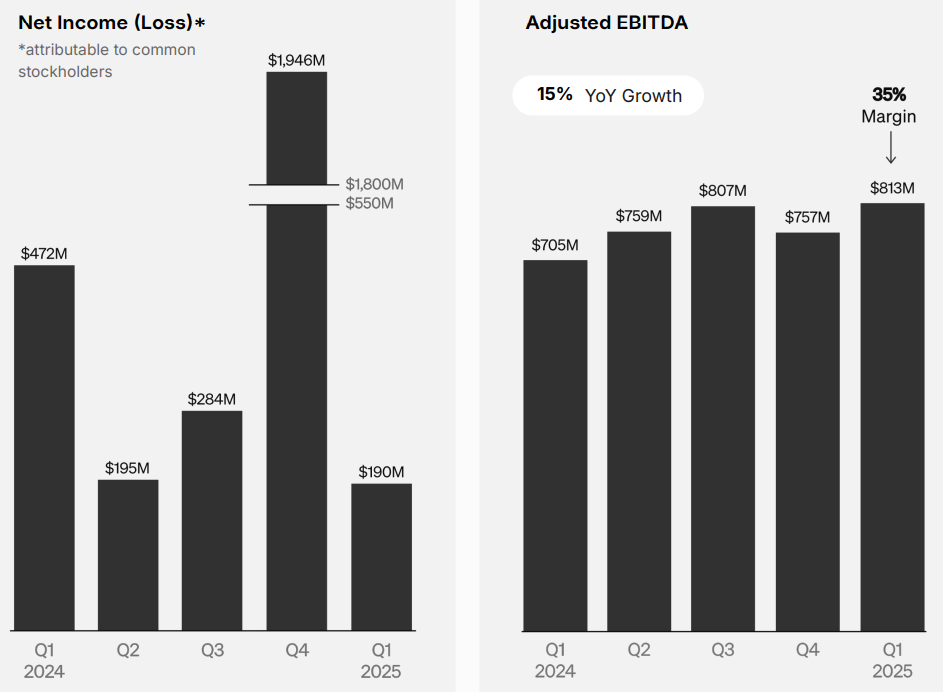
Each of Block’s platforms creates network effects: the more users, merchants, or creators join, the more value is created across the ecosystem. This drives retention, cross-product adoption, and increased gross profit per user — Block’s primary internal metric of success. | 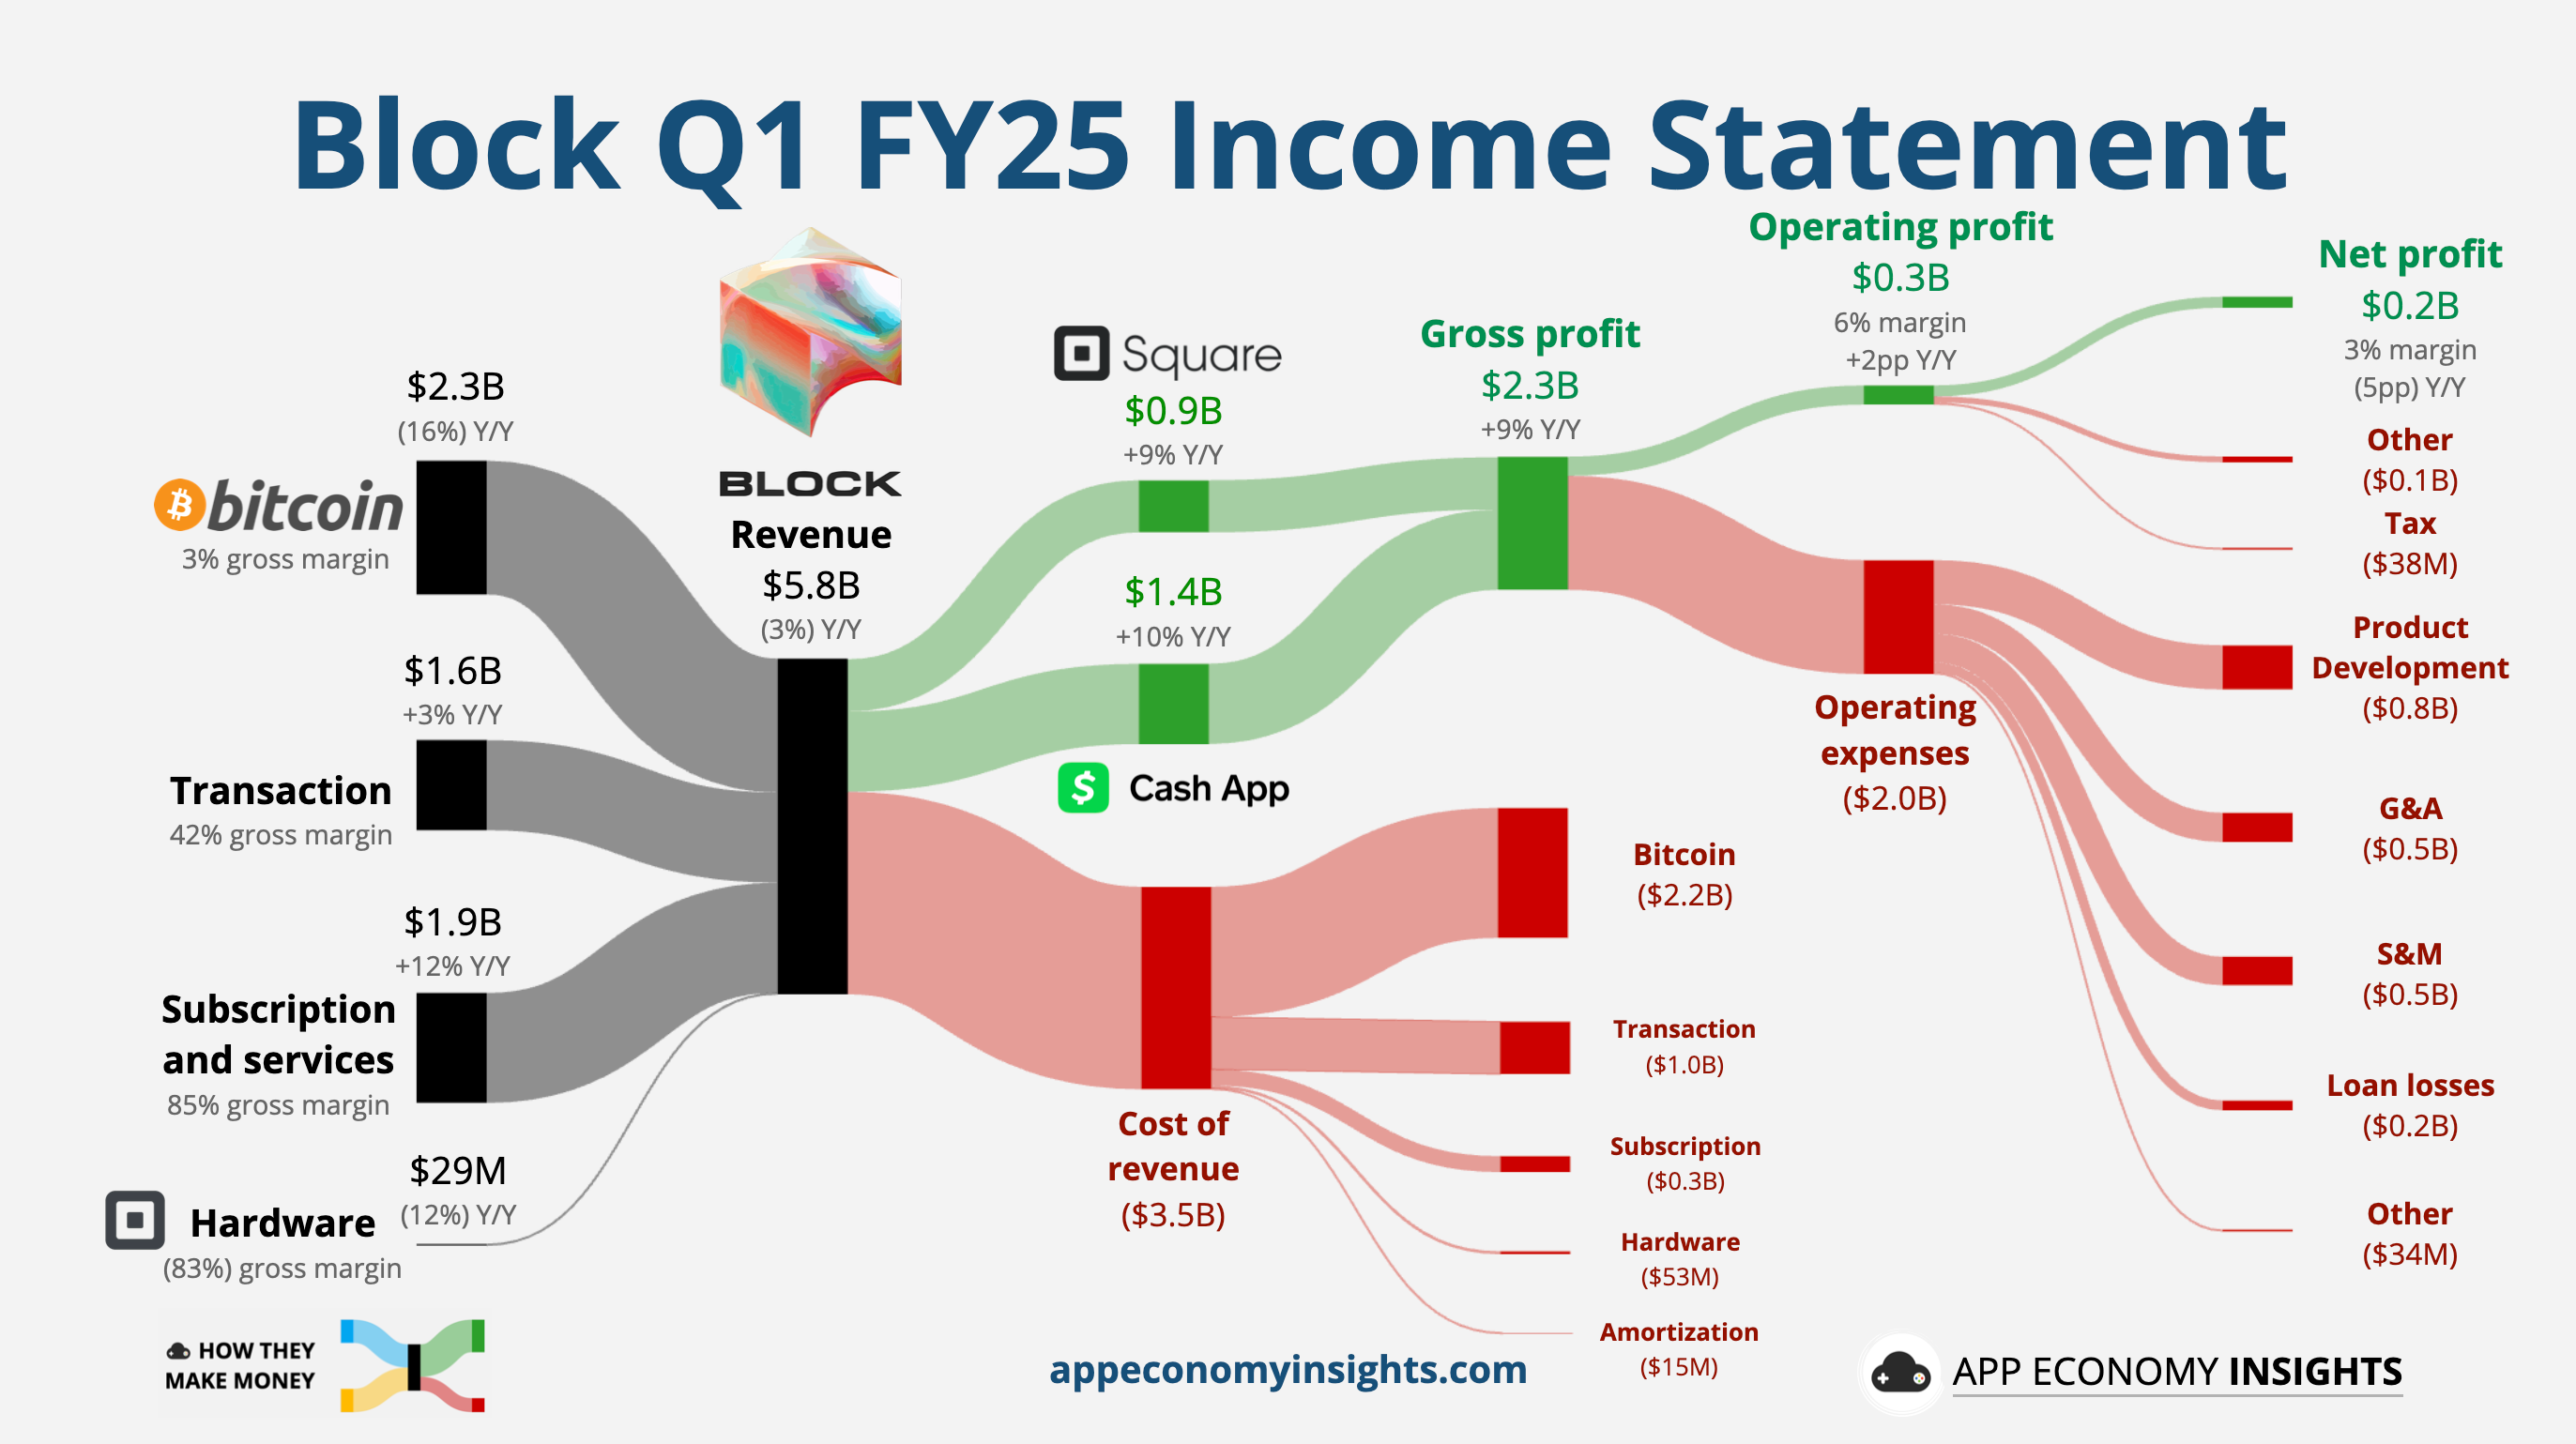 | Block Inc. entered 2024 with a mixed financial picture in Q1, showing revenue softness at the top line but continued strength in profitability and operational efficiency. Total revenue came in at $5.8 billion, marking a 3.1% year-over-year decline, largely driven by headwinds in lower-margin segments like Bitcoin and hardware.
Revenue Breakdown: Strength in Core Services, Weakness in Crypto
Transaction Revenue: $1.6 billion (+2.6% YoY) Subscription & Services Revenue: $1.9 billion (+12.4% YoY) Hardware Revenue: $29 million (-11.7% YoY) Bitcoin Revenue: $2.3 billion (-15.7% YoY)
The subscription and services business continues to outperform, underpinned by deeper engagement in both the Square and Cash App ecosystems. Meanwhile, Bitcoin-related revenue remains volatile and a drag on headline results.
Positive Underlying Metrics
Despite the top-line contraction, Block’s core performance metrics showed continued improvement: Gross Payment Volume (GPV): $56.8 billion (+4.4% YoY) Adjusted EBITDA: $813 million (+15.3% YoY) Adjusted Operating Margin: 20% (+300 bps YoY) EPS: $0.56 (+19% YoY) These results underscore a focus on operating leverage and improved margin discipline across the organization.
Guidance: Cautious Outlook Despite Operational Gains
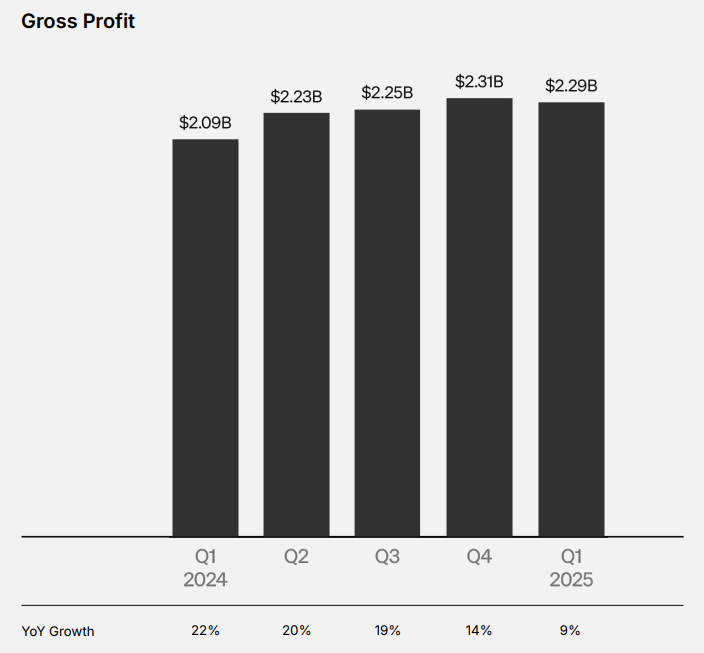
Looking ahead to Q2, Block expects: Gross profit of $2.45 billion, representing 9.5% YoY growth, but below Street estimates of $2.54 billion Operating margin of 18%, slightly down sequentially Management cited macroeconomic uncertainty, soft consumer spending, and slower inflows as the primary factors behind its conservative outlook.
FY 2024 Performance: Profitability Breakthrough
For the full year 2024, Block delivered: Gross Profit: $8.89 billion (+18% YoY) Square: +15% Cash App: +21% Adjusted EBITDA: $3.03 billion (+69% YoY) Adjusted Operating Income: $1.61 billion (4.5x YoY increase) Free Cash Flow: $2.07 billion (vs. $515 million in 2023) This marked a turning point in profitability, fueled by more efficient cost structures and deeper user monetization.
Block’s Q1 results confirm a company that is navigating near-term revenue volatility while quietly transforming into a leaner, more profitable operator. While macro conditions pose challenges, the momentum in core fintech services, strategic investments, and user engagement metrics suggest Block is well-positioned for a strong 2025 — particularly if topline growth reaccelerates.
| | | | |  | Barclays Maintains Overweight on Block, Lowers Price Target to $57
BMO Capital Downgrades Block to Market Perform, Lowers Price Target to $58
Keefe, Bruyette & Woods Maintains Outperform on Block, Lowers Price Target to $70
Piper Sandler Downgrades Block to Neutral, Lowers Price Target to $51
RBC Capital Maintains Outperform on Block, Lowers Price Target to $63 | 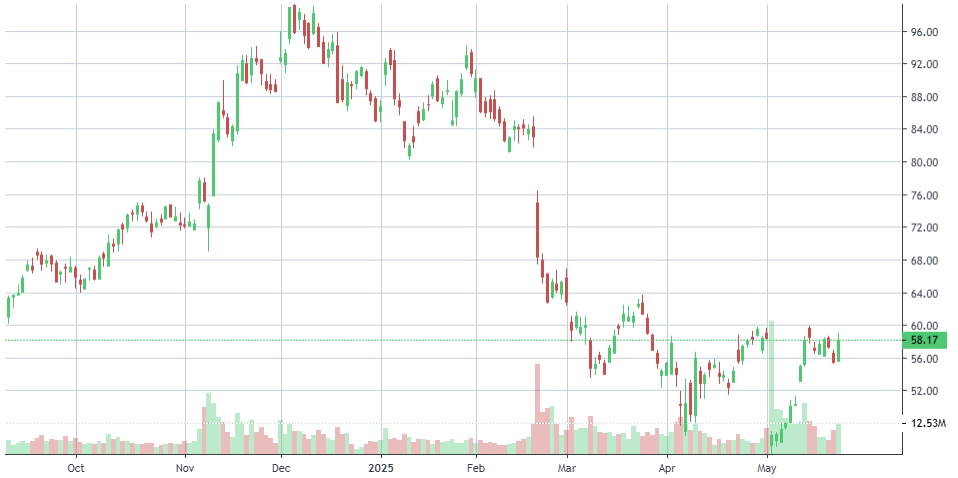 | | | Company: Lightspeed Commerce
Quote: $LSPD
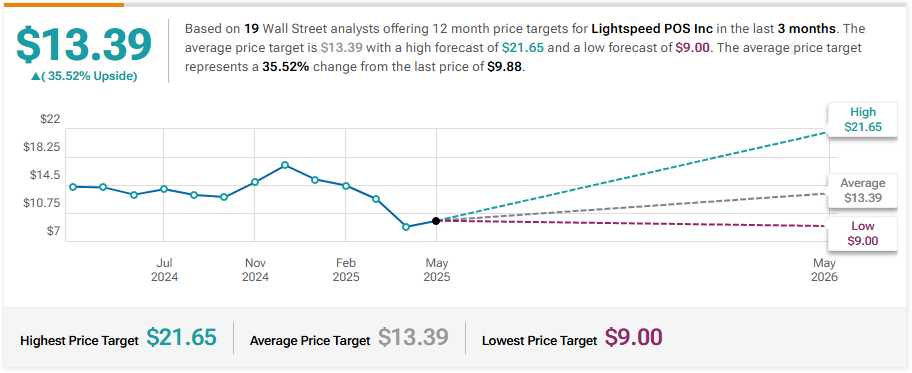
BT: $10
ST: $20-$22
Sharks Opinion: Lightspeed (LSPD) is shaping up with a thesis eerily similar to Block (XYZ) — a company we weren’t fond of at IPO but now sits more than 90% below its all-time highs, offering an intriguing setup for a speculative rebound or even strategic acquisition.
Back in 2021, LSPD was one of the best-performing stocks on the Toronto Stock Exchange, reaching a high of $124 per share during the pandemic-fueled tech surge. Today, it trades near $10, down more than 90% from peak, and back into the bargain bin of underappreciated software names.
We don’t consider Lightspeed a best-in-class operator long term — but at current levels, the risk/reward skews favorably. Especially with recent M&A activity in the sector, including Robinhood’s acquisition of WonderFi (another TSX-listed fintech), LSPD could find itself back on the radar of strategic buyers.
The company is dual-listed on the TSX and NYSE under the symbol LSPD, and operates across North America, Europe, and Asia-Pacific.
While growth has slowed post-pandemic and profitability remains a challenge, Lightspeed’s installed base of multi-location merchants, coupled with recurring software revenue, gives it asset value in a space ripe for consolidation.
Valuation reset: At ~$10/share, LSPD trades well below historical averages on both sales and gross profit multiples
M&A buzz: Robinhood-WonderFi deal last week shows renewed appetite for Canadian fintechs
Turnaround optionality: Any improvement in margins, execution, or top-line acceleration could trigger a repricing
Takeout target potential: With global reach and decent recurring revenue, Lightspeed may appeal to larger fintech or payments players looking to expand merchant services globally
We’re not making a long-term bull case for LSPD as a business but as a high-risk, high-upside swing trade, it looks compelling. If sentiment turns or a buyer steps in, this could double from current levels before the market even fully digests the news. The setup may be messy, but so was Block at $40.
Description: Lightspeed Commerce Inc. engages in sale of cloud-based software subscriptions and payments solutions single and multi-location retailers, restaurants, golf course operators, and one-stop commerce platform in North America, Europe, the United Kingdom, Australia, New Zealand, and internationally. Its cloud platform is designed around interrelated elements, such as omni-channel consumer experience, a comprehensive back-office operations management suite to improve customers' efficiency and insight, and the facilitation of payments. | | |  | Lightspeed Commerce is quietly undergoing a major transformation — one that the market has yet to recognize. At the heart of the turnaround is the return of founder and original CEO Dax Dasilva, who has re-assumed leadership and begun implementing aggressive restructuring measures to reset strategy, streamline operations, and refocus product execution.
Despite its depressed share price and macro headwinds, Lightspeed operates a highly relevant, vertically integrated commerce platform tailored to the underserved segment of small and mid-sized businesses (SMBs) across retail and hospitality.
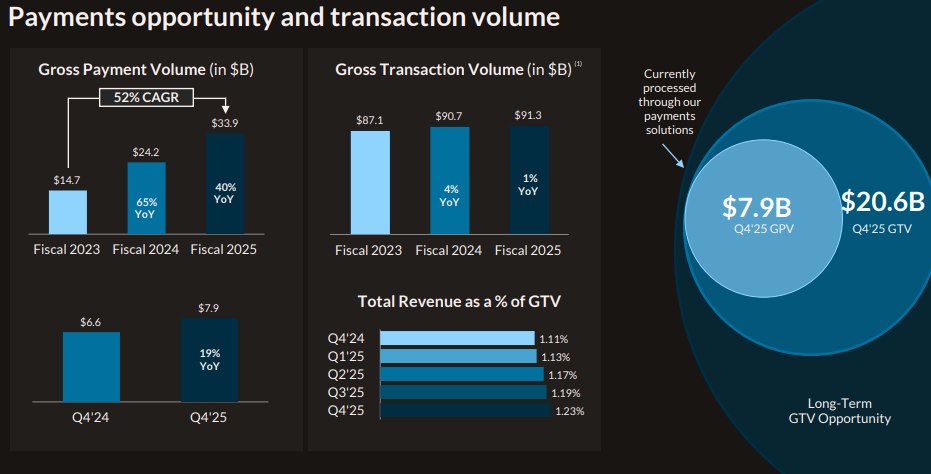
Today, Lightspeed trades near all-time lows, yet the underlying fundamentals suggest a business with real asset value and long-term optionality: Market Cap: $1.2 billion Enterprise Value: $550 million EV/LTM Sales: 0.5x EV/LTM Gross Profit: 1.3x Revenue: $1.1 billion (+22% YoY) Gross Profit: $438 million (+17.6% YoY, 41.6% margin) Operating Losses: -$112 million (-10.5% margin) Cash on Hand: $661 million This is a company trading at half its sales and just over 1x gross profit, despite having a robust product ecosystem, growing topline, and a cash position greater than its enterprise value — a rarity in the SaaS space.
Lightspeed may not yet be a best-in-class operator, but with founder-led restructuring, a well-defined vertical focus, and a balance sheet that provides time to execute, it checks every box for a deep-value tech turnaround. If execution improves — or if strategic buyers see what the market currently doesn’t — LSPD could be set for a meaningful re-rating. | 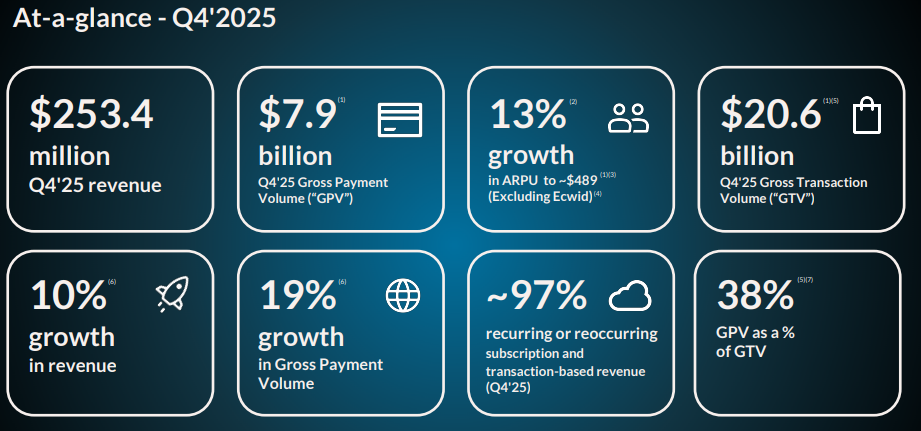 | Lightspeed delivered double-digit revenue growth in both Q4 and full fiscal year 2025, alongside significant improvements in adjusted profitability and cash flow efficiency. While headline losses were impacted by a large non-cash goodwill impairment, underlying performance metrics reflect early signs of traction from the company’s ongoing restructuring efforts.
Q4 FY2025 Highlights
Total Revenue: $253.4 million (+10% YoY) Transaction-Based Revenue: $157.8 million (+14% YoY) Subscription Revenue: $87.9 million (+8% YoY) Net Loss: ($575.9 million) or ($3.79) per share Includes a non-cash goodwill impairment of ($556.4 million) Adjusted Income: $15.0 million or $0.10 per share (vs. $8.5 million or $0.06 in Q4 2024) Adjusted EBITDA: $12.9 million (vs. $4.4 million YoY) Cash Used in Operating Activities: ($9.9 million), improved from ($28.5 million) YoY Adjusted Free Cash Flow Used: ($9.3 million), improved from ($16.3 million) YoY Cash Position (as of March 31, 2025): $558.5 million
Full-Year FY2025 Highlights
Total Revenue: $1.08 billion (+18% YoY) Transaction-Based Revenue: $697.3 million (+28% YoY) Subscription Revenue: $344.8 million (+7% YoY) Net Loss: ($667.2 million) or ($4.34) per share Includes the same $556.4 million goodwill impairment charge Adjusted Income: $69.5 million or $0.45 per share (vs. $24.5 million or $0.16 in FY2024) Adjusted EBITDA: $53.7 million (vs. $1.3 million YoY) Cash Used in Operating Activities: ($32.8 million), a significant improvement from ($97.7 million) in FY2024 Adjusted Free Cash Flow Used: ($11.2 million), compared to ($64.5 million) YoY
|  |  | Scotiabank Maintains Sector Perform on Lightspeed Commerce, Lowers Price Target to $10
Barclays Maintains Equal-Weight on Lightspeed Commerce, Lowers Price Target to $12
Morgan Stanley Maintains Equal-Weight on Lightspeed Commerce, Lowers Price Target to $12
JP Morgan Downgrades Lightspeed Commerce to Underweight, Lowers Price Target to $9 | 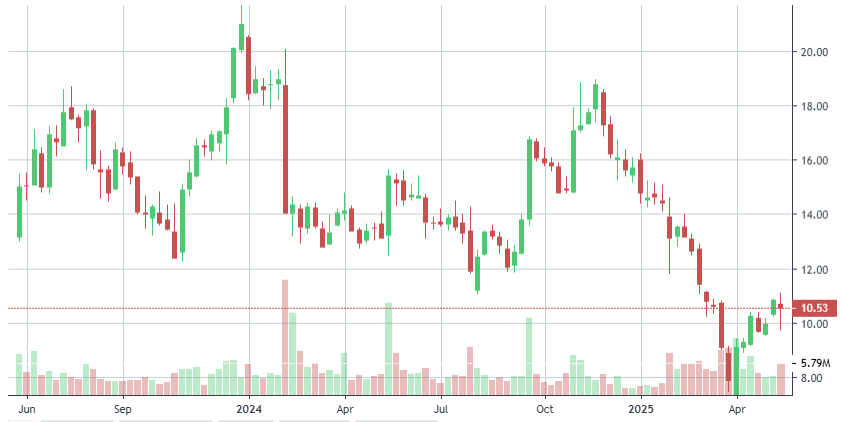 | | | Company: Sandisk Corporation
Quote: $SNDK
BT: $32-$35
ST: $60- $62
Sharks Opinion:
SanDisk has officially returned to public markets following its long-anticipated spin-off from Western Digital Corp. (WDC) in February. Now operating as a standalone company, SanDisk focuses on solid-state drive (SSD) technology, powered by its proprietary 3D NAND architecture — distinguishing it from Western Digital, which retains its legacy hard disk drive (HDD) business.
Spin-offs like this are exactly the kind of setups we look for: core assets separated in a theme-driven market, unlocking value that was previously buried inside a broader, less focused parent company.
A Story Three Years in the Making
Back in May 2022, Elliott Management — a high-profile activist investor — took a stake in Western Digital and publicly called for a separation of the SSD and HDD divisions. The thesis was simple: these were fundamentally different businesses with different margin profiles, capital requirements, and growth trajectories. Nearly three years later, that separation is complete, and Elliott’s vision is playing out. SanDisk is now positioned to operate independently, set its own capital strategy, and pursue growth in a faster-moving, higher-margin storage market — including edge computing, mobile devices, and AI infrastructure.
Strategic Profile: Asia-Centric, Tech-Leveraged, AI-Exposed
67% of SanDisk’s revenue is derived from Asia, with a smaller footprint in the U.S. (~15%)
Operates manufacturing facilities in Malaysia, Japan, and China
Its exposure to AI infrastructure and edge computing puts it in the middle of one of the market’s most popular (and premium-valued) themes
While the AI narrative may currently be overhyped, SanDisk is one of the few newly public names that offers real hardware exposure to data infrastructure without being a pure GPU or data center play.
Why We Like It
Spin-off mechanics: SanDisk is now able to define its growth path, margins, and investor communication without being weighed down by the HDD legacy business
Structural tailwinds: SSD adoption continues to replace HDDs across consumer and enterprise markets
Theme alignment: Storage is a non-optional layer of the AI and edge stack, giving SanDisk relevance in multiple tech verticals
Activist backing: Elliott Management’s track record in driving corporate action and surfacing hidden value gives this story added credibility
Description: Sandisk Corporation develops, manufactures, and sells data storage devices and solutions using NAND flash technology in the United States, Europe, the Middle East, Africa, Asia, and internationally. The company offers solid state drives for desktop and notebook PCs, gaming consoles, and set top boxes; and flash-based embedded storage products for mobile phones, tablets, notebook PCs and other portable and wearable devices, automotive applications, Internet of Things, industrial, and connected home applications, as well as removable cards, universal serial bus drives, and wafers and components. | | | 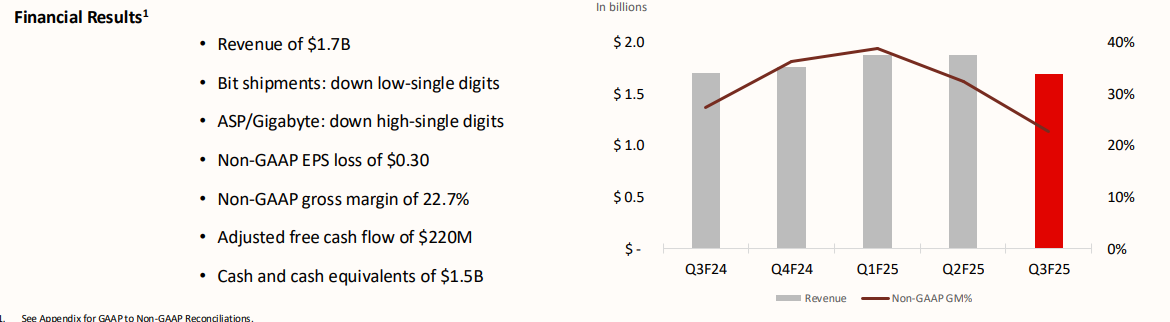 | At its February 12 investor day, newly re-listed SanDisk offered a snapshot of its recent financial history, highlighting the challenges it faces post-spin-off as it works toward standalone profitability. The company reported a notable decline in revenue, with GAAP losses and negative free cash flow over the past two fiscal years. However, leadership has laid out a clear path to recovery, targeting breakeven cash flow and long-term growth.
Historical Financial Overview (FY2022–FY2024)
FY2022 Revenue: $9.75 billion FY2024 Revenue: $6.66 billion FY2023 & FY2024: Marked by net losses and negative free cash flow CEO David Goeckeler reiterated that SanDisk needs to return to a $10 billion annual revenue run rate to generate positive free cash flow. Assuming a 10% annual growth rate, the company expects to hit that threshold within three years. Internal projections suggest FY2025 revenue of ~$7.5 billion, setting the foundation for a long-term rebound.
Q3 FY2025: First Earnings Report as a Standalone Company
SanDisk’s first quarterly earnings report since separating from Western Digital was a mixed bag — better-than-expected revenue, but weighed down by a substantial goodwill impairment charge.
Key Q3 Metrics:
Revenue: $1.70 billion (▲ above guidance, ▼ 10% sequentially) GAAP Net Loss: $1.93 billion Includes $1.83 billion goodwill impairment Non-GAAP Loss per Share: ($0.30) Previous Quarter GAAP Profit: $104 million Bit Shipments: Down low-single digits ASP (Average Selling Prices): Down high-single digits Q4 FY2025 Guidance: Cautiously Optimistic
Revenue Forecast: $1.75 billion – $1.85 billion Non-GAAP EPS: Expected between ($0.10) and $0.15 Management acknowledged continued pricing pressure in NAND markets and macro headwinds but emphasized that the business is stabilizing and working toward margin recovery and operational discipline.
Bottom Line: Early Volatility but Long-Term Leverage
SanDisk’s early standalone performance reflects a business still finding its footing, with weak ASPs, inventory digestion, and macro softness weighing on short-term results. However, with a long-term target of $10 billion in annual revenue and positive free cash flow as the North Star, the current setup offers deep-value potential for patient investors.
The turnaround hinges on: Pricing recovery in NAND markets Volume growth through AI/data-centric demand
Execution on cost structure and capital discipline With the spin-off now complete, the stage is set and SanDisk’s recovery story is just beginning. | 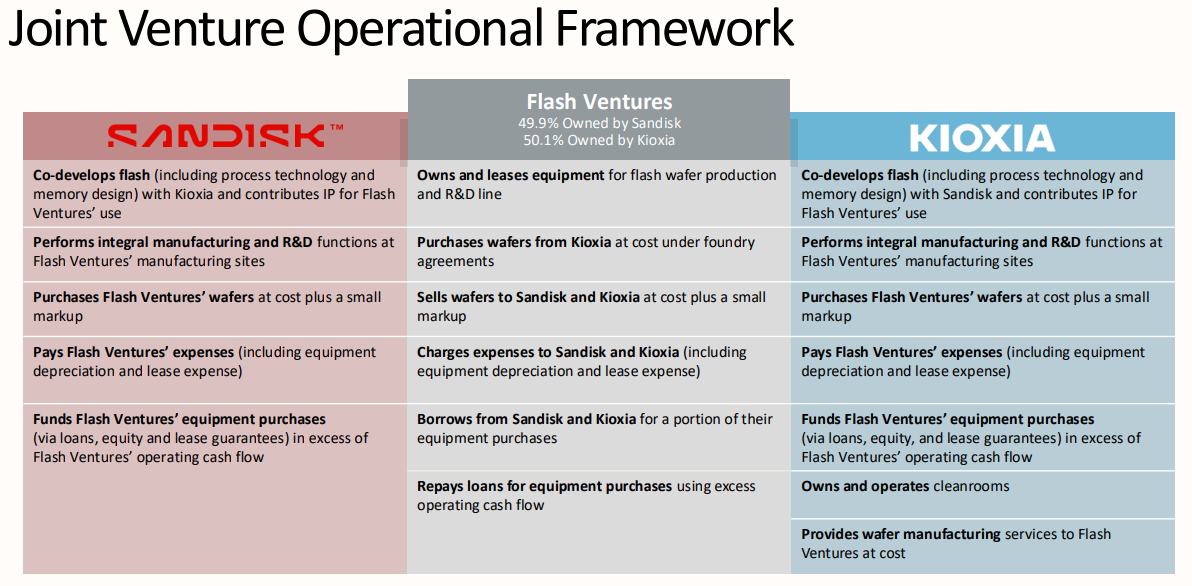 | Since its return to the public markets, SanDisk has struggled to find its footing not necessarily due to fundamental failure, but rather a combination of headline risk, spin-off dynamics, and sector-wide pessimism. The sell-off that followed its re-listing has been driven more by perception than performance, offering a potential opportunity for contrarian investors.
Kioxia Comparison: Monetization Disparity in the JV
SanDisk’s long-standing joint venture with Kioxia (formerly Toshiba Memory) remains critical to its NAND flash supply chain. Yet, recent projections suggest a growing gap in how effectively each partner is monetizing output: Kioxia projects FY2024–2025 revenue of $11.3 billion, significantly outpacing SanDisk’s expected ~$7.5 billion
While both firms receive roughly 50% of the NAND chip output from their JV fabs, Kioxia appears to be executing better on pricing, mix, or downstream integration This underscores a key challenge for SanDisk: turning scale into margin, particularly in a deflationary pricing environment for memory products.
Why the Market Hit the Sell Button
SanDisk’s early trading history as a spin-off has been marred by several overlapping investor concerns:
Exposure to Asia With 67% of revenue derived from Asia, investors worry about trade retaliation risk — especially amid U.S.-China tensions and potential tariffs on electronics Cyclical Industry Fears
As a semiconductor and memory player, SanDisk operates in a highly cyclical market
With ongoing recession concerns, memory stocks are often early casualties in macro selloffs
Spin-Off Dislocation Many institutional investors inherited SanDisk shares via the WDC separation Lacking familiarity, thesis alignment, or index inclusion, portfolio managers often sell first, ask later
Structural Pricing Pressure NAND and flash storage are in long-term price decline, even as use cases expand
SanDisk’s large consumer-facing segment is especially exposed to margin erosion
Tariff Fears on Consumer Electronics Given SanDisk’s reliance on consumer NAND and flash, investors fear tariffs on downstream electronics could hit demand and pricing power
Bottom Line: Narrative Overhang, But Not a Broken Business
SanDisk’s recent selloff reflects more narrative dislocation than operational collapse. While there are valid concerns around competition, pricing, and exposure to Asia, the company remains a key global NAND supplier with scale, infrastructure, and long-term relevance in storage markets — particularly as AI, edge computing, and mobile devices continue to scale.
For long-term investors who understand spin-off mechanics and can navigate volatility, SanDisk’s current valuation may offer deep-value upside, especially if the company narrows its execution gap with Kioxia and pricing stabilizes industry-wide. | 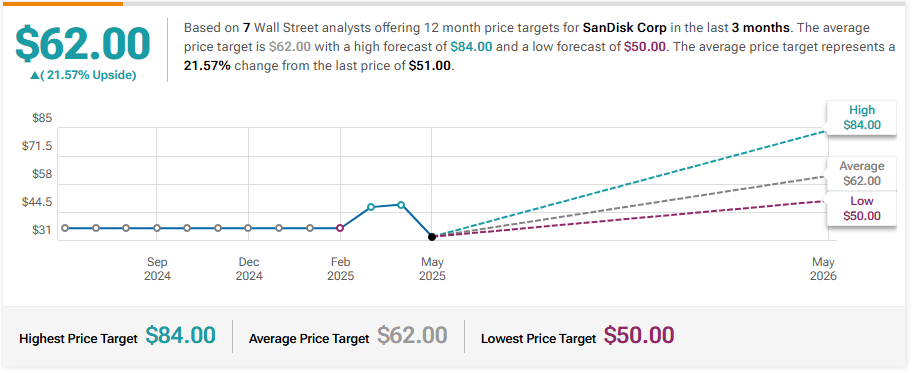 | Wells Fargo Maintains Equal-Weight on SanDisk, Lowers Price Target to $45
Morgan Stanley Maintains Overweight on SanDisk, Lowers Price Target to $70
Barclays Maintains Equal-Weight on SanDisk, Lowers Price Target to $39
Mizuho Maintains Outperform on SanDisk, Lowers Price Target to $50 | 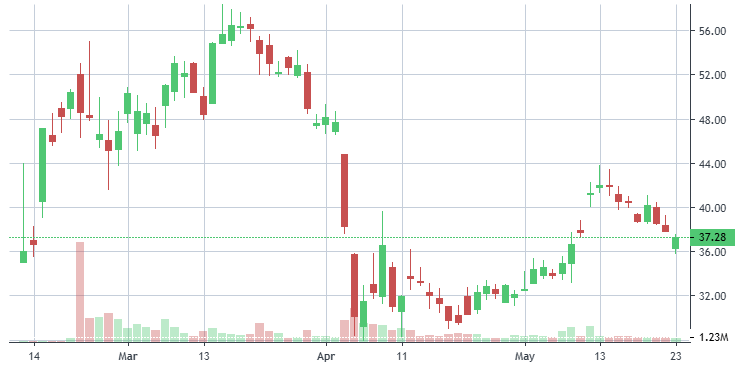 | | | © Copyright, 2025, info@stocksharksresearch.com
This newsletter is sent to you, because you are a customer or subscriber of Stocks | | | This material has been prepared by a sales or trading employee or agent of StockSharks Inc. and is, or is in the nature of, a solicitation. This material is not a research report prepared by StockSharks Research Department. By accepting this communication, you agree that you are an experienced user of the futures markets & Stock market, capable of making independent trading decisions, and agree that you are not, and will not, rely solely on this communication in making trading decisions. DISTRIBUTION IN SOME JURISDICTIONS MAY BE PROHIBITED OR RESTRICTED BY LAW. PERSONS IN POSSESSION OF THIS COMMUNICATION INDIRECTLY SHOULD INFORM THEMSELVES ABOUT AND OBSERVE ANY SUCH PROHIBITION OR RESTRICTIONS. TO THE EXTENT THAT YOU HAVE RECEIVED THIS COMMUNICATION INDIRECTLY AND SOLICITATIONS ARE PROHIBITED IN YOUR JURISDICTION WITHOUT REGISTRATION, THE MARKET COMMENTARY IN THIS COMMUNICATION SHOULD NOT BE CONSIDERED A SOLICITATION. The risk of loss in trading futures and/or options is substantial and each investor and/or trader must consider whether this is a suitable investment. Past performance, whether actual or indicated by simulated historical tests of strategies, is not indicative of future results. Trading advice is based on information taken from trades and statistical services and other sources that StockSharks Inc. believes are reliable. We do not guarantee that such information is accurate or complete and it should not be relied upon as such. Trading advice reflects our good faith judgment at a specific time and is subject to change without notice. There is no guarantee that the advice we give will result in profitable trades. | | | | |