| | Members overview
This is a list of stocks that members asked us to do extra research on none of these are alerts/buy/sell recommendations. |
| | | | Company: C3.ai, Inc.
Quote: $AI
BT: N/A
ST: $11 - $15
Sharks Opinion:
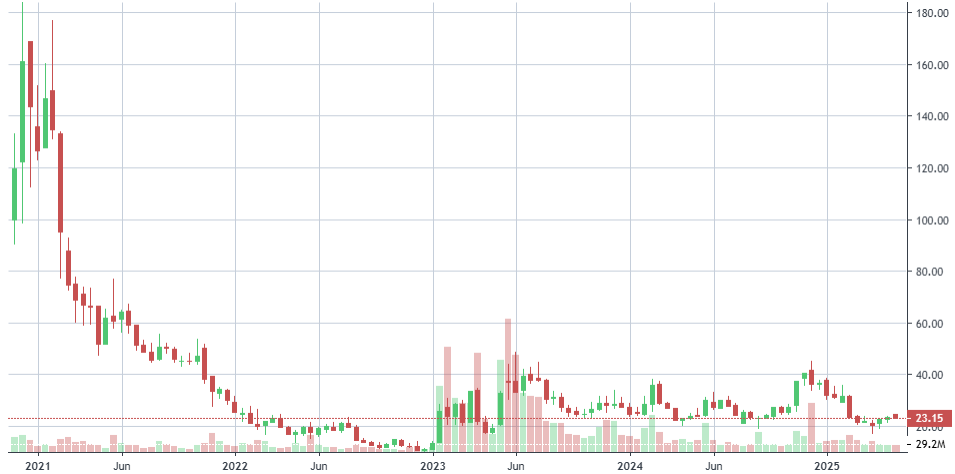
C3.ai captured investor attention in 2023 during the early wave of enthusiasm around generative AI. That year, shares soared 157%, riding the coattails of the ChatGPT boom. While the stock managed another 20% gain in 2024, momentum has since cooled. Year-to-date, shares are down over 30%, reflecting a growing disconnect between AI hype and company fundamentals.
We've followed C3.ai closely since its 2021 IPO, when some dubbed it the “LeBron James of AI.” From the beginning, however, we viewed the company more as a product of hype than of substance and four years later, with no sustained profitability, that view remains largely validated.
With earnings set to be released next week, C3.ai has a chance to change the narrative but expectations should remain measured. The stock has rebounded slightly from recent lows, but it's still down nearly 50% from its 52-week high of $45.08.
For contrarian investors, the current bearish sentiment could present a speculative opportunity. A strong earnings print particularly one showing improvement on the bottom line could trigger a sharp upside move. That said, without meaningful progress toward profitability, any rally may prove short-lived.
Description: C3.ai, Inc. operates as an enterprise artificial intelligence (AI) software company in North America, Europe, the Middle East, Africa, the Asia Pacific, and internationally. The company provides C3 AI platform, an application development and runtime environment that enables customers to design, develop, and deploy enterprise AI applications; C3 AI CRM Suite, an industry specific customer relationship management solution; and C3 Generative AI that enables to locate, retrieve, present information, disparate data stores, applications, and enterprise information systems. | | | 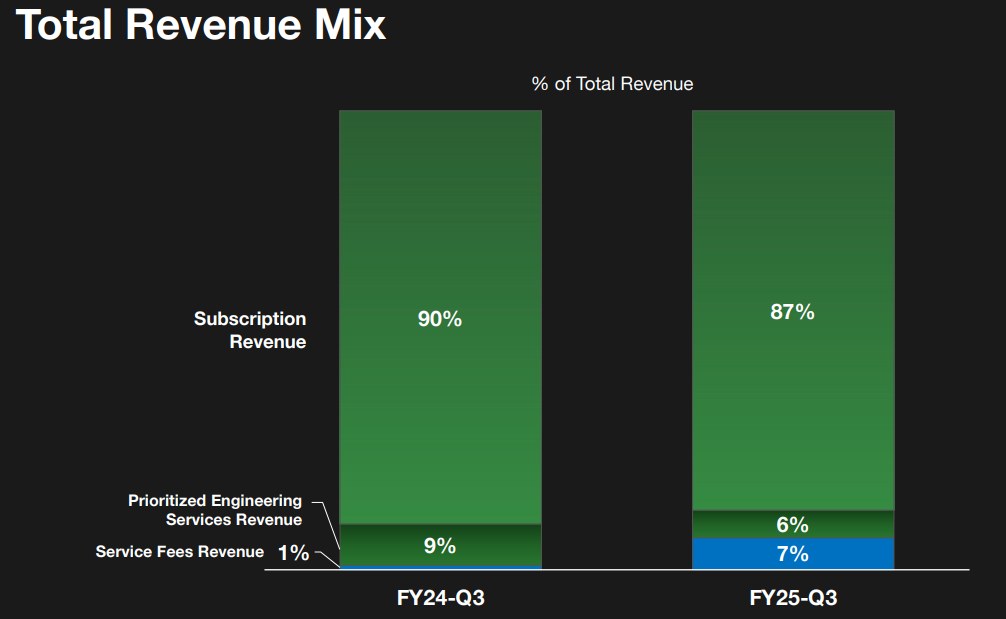 | C3.ai has posted solid top-line growth in recent quarters, benefitting from the broad adoption of artificial intelligence across industries. As more companies seek to integrate AI into their operations, demand for C3.ai’s enterprise offerings has increased — helping sustain a positive revenue trajectory since early 2023.
The company offers over 130 pre-built AI applications, positioning itself as a turnkey solution for businesses aiming to deploy AI quickly and at scale. This plug-and-play approach has helped it attract customers, and any acceleration in revenue or strong forward guidance in the upcoming earnings report could reignite investor interest.
However, despite this growth, the stock has failed to gain meaningful traction — a sign that investors remain wary of the company’s underlying financials. C3.ai has yet to deliver a path to profitability, with its narrowest quarterly loss still coming in at $63 million over the past three years.
While the business is scaling, it’s not translating into operating leverage. This raises questions about the sustainability of its customer acquisition strategy, with some suggesting that heavy reliance on promotions or pricing incentives may be inflating growth at the expense of margin stability.
Unless C3.ai can pair continued top-line expansion with a credible roadmap to profitability, skepticism is likely to remain — even in a market eager for AI exposure. | 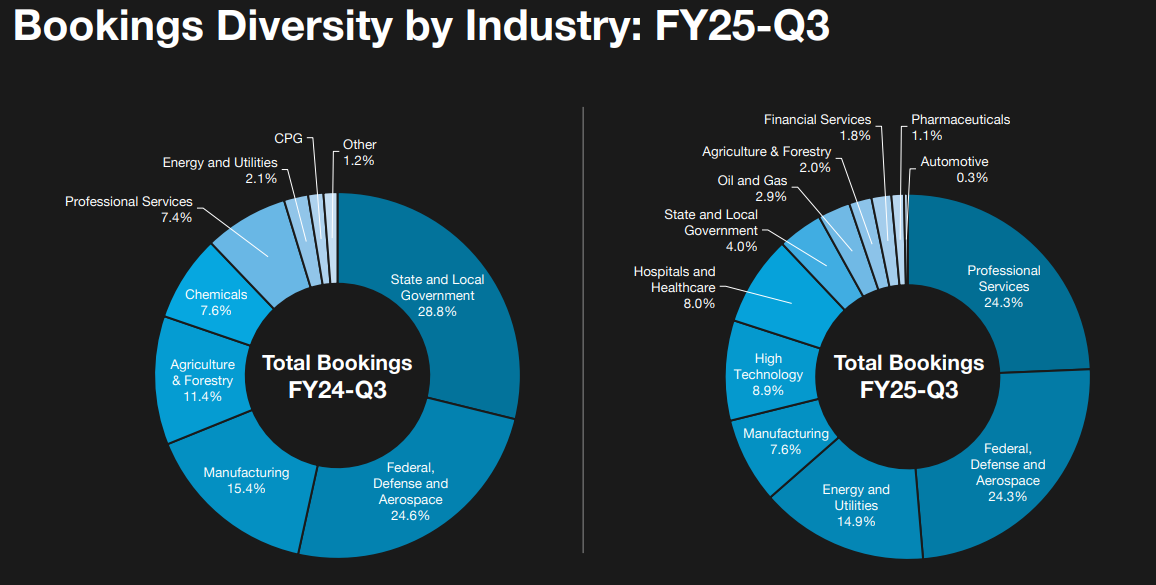 | 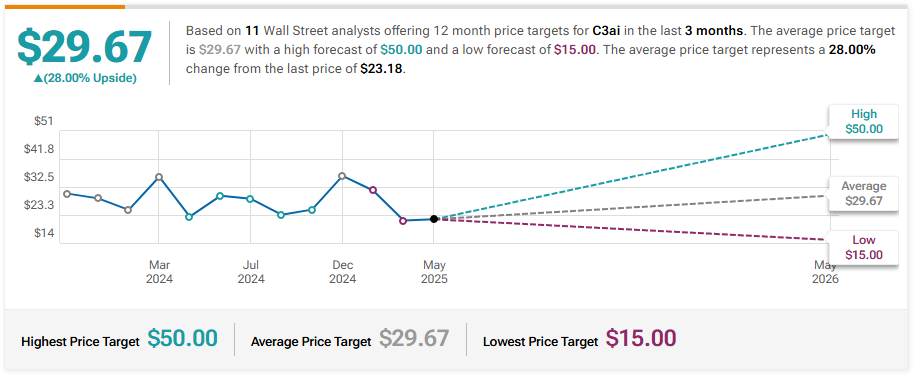 | Keybanc Maintains Underweight on C3.ai, Lowers Price Target to $17
Canaccord Genuity Maintains Hold on C3.ai, Lowers Price Target to $30
DA Davidson Maintains Neutral on C3.ai, Lowers Price Target to $25
Keybanc Maintains Underweight on C3.ai, Lowers Price Target to $21
Morgan Stanley Maintains Underweight on C3.ai, Lowers Price Target to $30
Piper Sandler Maintains Neutral on C3.ai, Lowers Price Target to $28
|  | | | Company: SoFi Technologies, Inc.
Quote: $SOFI
BT: $10-$12
ST: $18
Sharks Opinion:
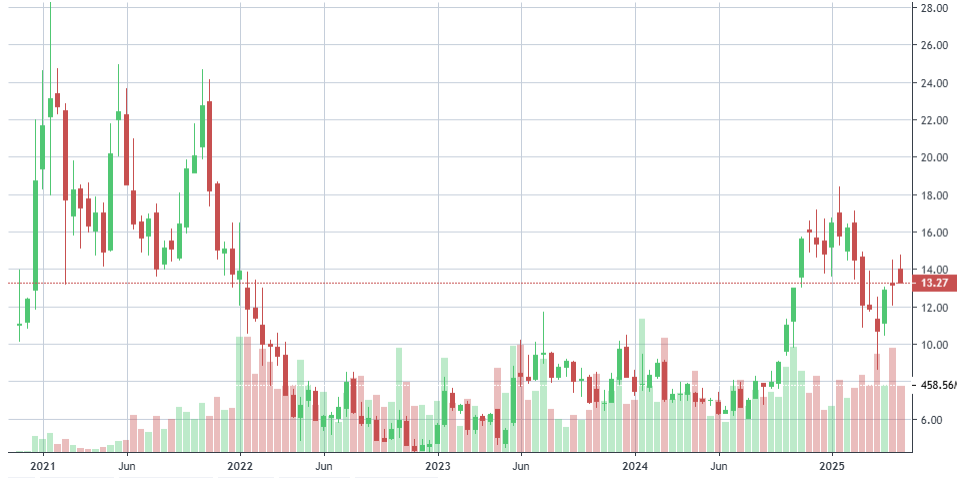
SoFi Technologies has long been on our radar dating back to its pre-SPAC fundraising days and while the company generated early excitement post-IPO, the stock has largely underperformed since peaking shortly after its De-SPAC debut. Today, SOFI trades just $2 above its original listing price, yet recent momentum has reignited bullish sentiment.
As of May 14, shares are up 47% over the past five weeks, driven by a broad-based rally in growth stocks, easing trade tensions, and a wave of stronger-than-expected corporate earnings. If macro conditions continue to improve — particularly around interest rates — SoFi could be well-positioned to deliver further gains, especially as it moves closer to sustainable profitability.
SoFi’s land-and-expand strategy remains one of its core strengths. The company continues to leverage its broad product ecosystem spanning lending, banking, and investing to deepen customer engagement and expand wallet share. In Q4 FY24, SoFi reported GAAP revenue of $734.1 million, a 19.3% year-over-year increase that beat both internal estimates and Street expectations.
Management also guided for $640–$645 million in EBITDA and tangible book value (TBV) growth of $1.00–$1.05 billion, supported by strong loan sale revenues and capital-light fee-based platforms. These figures reflect a business model gaining operational scale while expanding across key verticals.
Despite its solid fundamentals, SoFi is not immune to broader macro risks. As a financial services provider, its outlook remains highly sensitive to Federal Reserve policy, interest rate trends, and consumer credit conditions.
The threat of prolonged high rates could compress margins, while proposed tariff hikes under a potential second Trump administration raise the specter of recessionary pressures that could weigh on loan demand and consumer spending.
While the recent rally in SOFI shares may reflect renewed optimism, long-term upside will depend on the company’s ability to sustain profitability and navigate a volatile economic environment. If those two pieces align, SoFi could once again become a standout name in the fintech space.
Description: SoFi Technologies, Inc. provides various financial services in the United States, Latin America, Canada, and Hong Kong. It operates through three segments: Lending, Technology Platform, and Financial Services. The company offers lending and financial services and products that allows its members to borrow, save, spend, invest, and protect money; and personal loans, student loans, home loans, and related services. The company also operates Galileo, a technology platform that offers services to financial and non-financial institution; and Technisys, a cloud-native digital and core banking platform that provides software licenses and associated services, including implementation and maintenance. | | | 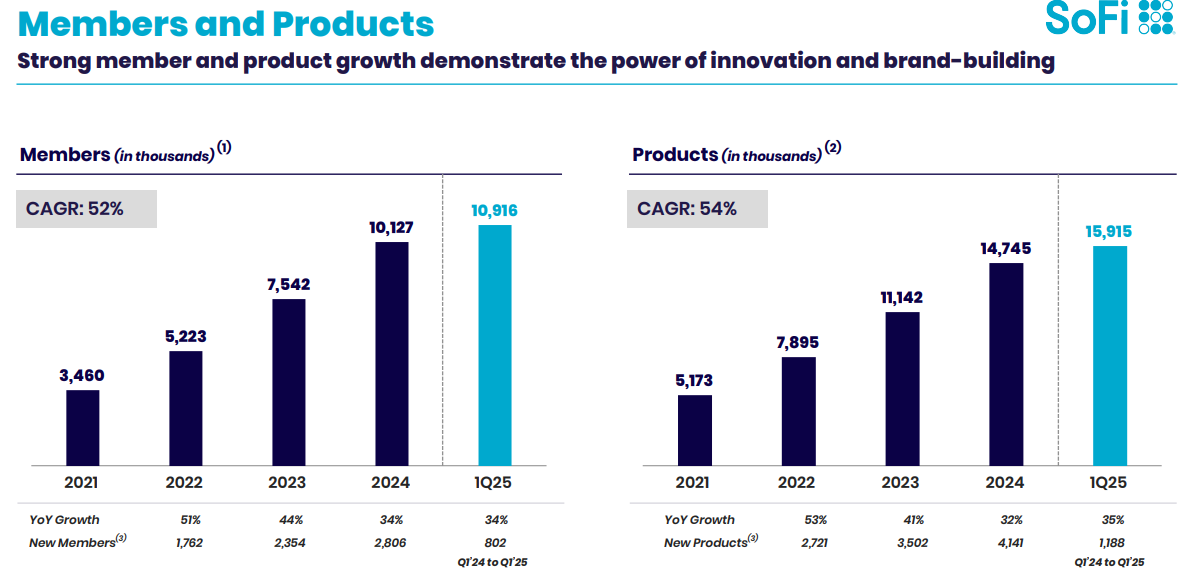 | SoFi’s latest results continue to reinforce its long-term bullish thesis. In the first quarter of 2025, the company delivered a 20% year-over-year increase in net sales and an impressive 217% surge in net income, underscoring its growing operating leverage and the benefits of scalable infrastructure. Notably, SoFi added 800,000 new members during the quarter — the largest single-quarter increase to date — which further enhances cross-sell potential and helps drive down customer acquisition costs.
Broad-Based Growth Across Business Segments
All three of SoFi’s business units contributed to revenue growth: Lending revenue rose 25% YoY Technology platform revenue increased 10% Financial Services segment surged 101%, pointing to rising adoption across the broader fintech ecosystem
Looking ahead, full-year 2025 revenue is projected at $3.26 billion, a 25% increase over 2024 — a continuation of the company’s strong top-line trajectory.
From Losses to Profits: Turning the Financial Corner
In 2023, SoFi reported a net loss of $301 million, consistent with its aggressive, growth-first strategy.
However, 2024 marked an inflection point, as the company swung to profitability with $499 million in net income, translating to a net margin of 18.7%. Management has signaled confidence in continued bottom-line expansion, and Wall Street analysts project SoFi’s EPS to grow 87% between 2024 and 2027.
While long-term forecasts should always be treated with caution, SoFi’s recent execution lends credibility to its path forward. Continued focus on profit growth and disciplined cost management will be key as macro conditions evolve. | 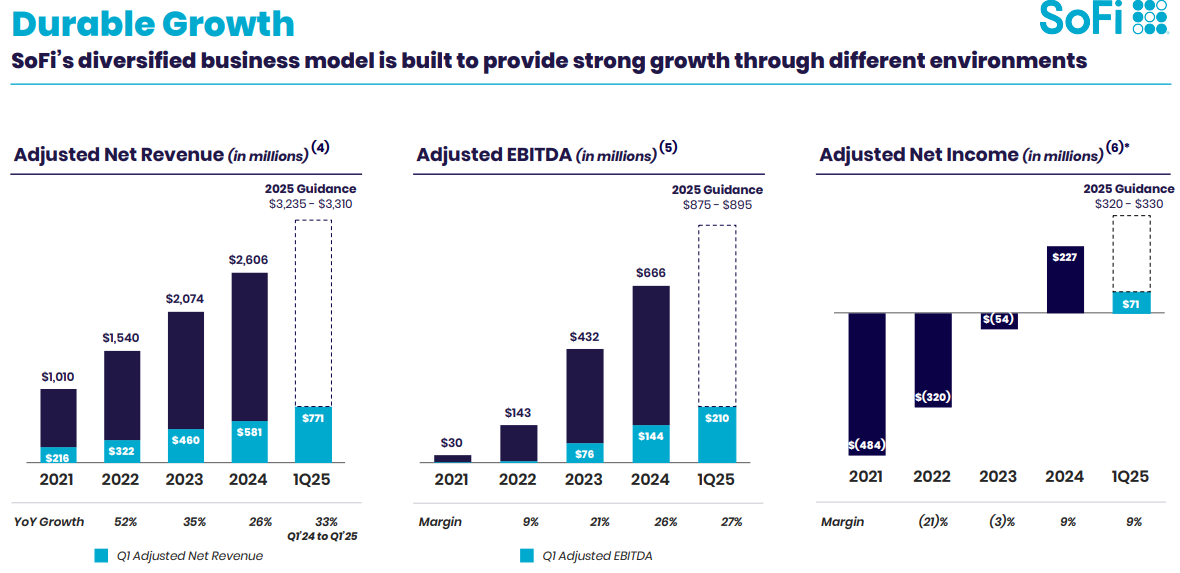 | 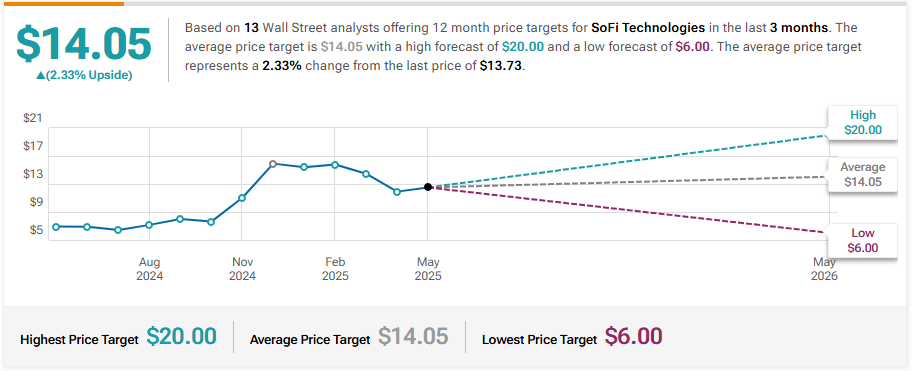 | Barclays Maintains Equal-Weight on SoFi Technologies, Raises Price Target to $12
UBS Maintains Neutral on SoFi Technologies, Raises Price Target to $15.5
Needham Reiterates Buy on SoFi Technologies, Maintains $20 Price Target
JMP Securities Initiates Coverage On SoFi Technologies with Market Outperform Rating, Announces Price Target of $17
Goldman Sachs Maintains Neutral on SoFi Techs, Raises Price Target to $9.5
|  | | | Company: Vir Biotechnology, Inc.
Quote: $VIR
BT: N/A
ST: $8-$9 based on cash on balance sheet
Sharks Opinion:
Vir Biotechnology is a name we were largely unfamiliar with prior to this report. The company develops treatments for infectious diseases and cancer, leveraging immunological science to combat conditions such as solid tumors. At its core, Vir aims to harness the body’s immune system — a compelling biotech proposition that attracted significant investor interest during the COVID-19 pandemic.
Like many biotech companies that surged during the crisis, however, Vir’s momentum has since faded. It now joins a broader group of post-pandemic biotech names that have struggled to maintain relevance amid shifting investor sentiment and sector-wide valuation resets. On the positive side, Vir maintains a strong cash position, which significantly reduces the risk of near-term share dilution — a common concern in early-stage biotech.
However, beyond its balance sheet strength, assessing the company’s valuation or forecasting its growth remains extremely difficult.
The inherently binary nature of drug development, coupled with regulatory unpredictability, makes this a highly speculative name.
In summary, Vir may warrant a watchlist spot for biotech-focused investors, but its long-term trajectory remains opaque, hinging on clinical outcomes and regulatory milestones that are difficult to model with precision.
Description: Vir Biotechnology, Inc., a clinical-stage biopharmaceutical company, discovers and develops therapeutic products to treat and prevent serious infectious diseases in the United States and internationally. Its clinical development pipeline consists of product investigational therapies targeting hepatitis delta virus (HDV) and other solid tumors.The company's preclinical candidates include those targeting influenza A and B, coronavirus disease 2019, respiratory syncytial virus (RSV) and human metapneumovirus (MPV), and human papillomavirus (HPV). | | | 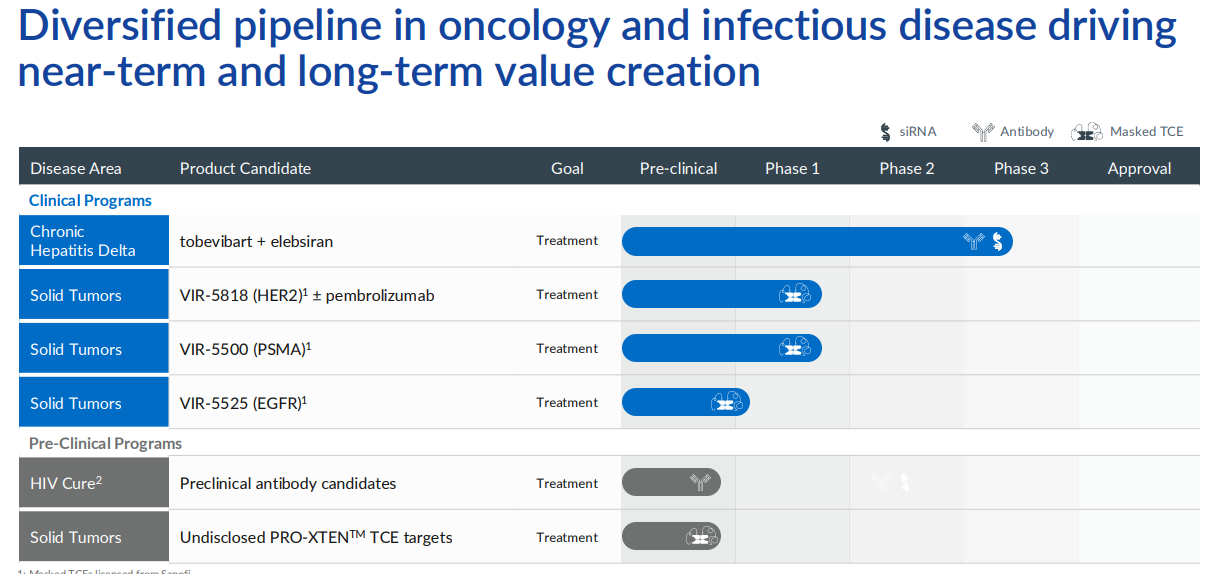 | Vir Biotechnology continues to evolve its strategic focus, advancing a diversified pipeline across immuno-oncology and infectious diseases, even as it contends with revenue headwinds. The company recently enrolled its first patient in the Phase 3 ECLIPSE program for chronic Hepatitis Delta (CHD), marking a key milestone in strengthening its late-stage clinical portfolio and boosting investor confidence.
Pipeline Highlights
Chronic Hepatitis Delta (CHD)
The Phase 3 ECLIPSE registrational trial in CHD is now underway, with first patient enrollment expected in the first half of 2025.
Vir previously presented positive Phase 2 SOLSTICE trial data at the 2024 AASLD Liver Meeting, showcasing meaningful antiviral activity and helping validate its long-term therapeutic strategy in liver disease.
Solid Tumors
In January 2025, Vir shared promising early data from its dual-masked T-cell engager (TCE) programs.
Key results included: VIR-5818, a HER2-targeting dual-masked TCE, demonstrated tumor shrinkage in 50% (10/20) of patients receiving ≥400 µg/kg Confirmed partial responses in 33% (2/6) of patients with HER2-positive colorectal cancer These findings support further development of Vir’s oncology pipeline and highlight early signs of clinical efficacy.
Chronic Hepatitis B (CHB)
Vir expects functional cure data from its MARCH Part B Phase 2 trial in Q2 2025, a potential catalyst for the stock if results prove compelling. Preclinical Pipeline
Vir is also progressing multiple undisclosed dual-masked TCE candidates, targeting validated oncology markers. These assets are built using the company’s proprietary PRO-XTEN™ masking platform and its AI-powered antibody discovery engine, dAIsY™ — designed to optimize therapeutic design and specificity across a range of solid tumors.
Financial Snapshot: Q4 & FY24
Despite a pullback in top-line performance, Vir made strides in cost optimization and pipeline prioritization: Q4 revenue fell to $12.4 million, down from $16.8 million YoY FY24 revenue totaled $74.2 million, vs. $86.2 million in FY23 Revenue declines stemmed largely from lower grant income and reduced GSK profit-sharing
Operating expenses also declined to $506.5 million, aided by program discontinuations and cost-saving initiatives. This was partially offset by a $102.8 million upfront payment to Sanofi as part of a strategic licensing agreement. G&A costs fell significantly to $119.0 million, down from $174.4 million the previous year.
Balance Sheet & Outlook
Vir ended FY24 with a robust $1.10 billion in cash, cash equivalents, and investments, down from $1.63 billion, primarily due to strategic investments like the Sanofi deal. Nevertheless, the company’s cash runway extends into mid-2027, providing ample capital to fund its clinical pipeline without near-term dilution risk. | 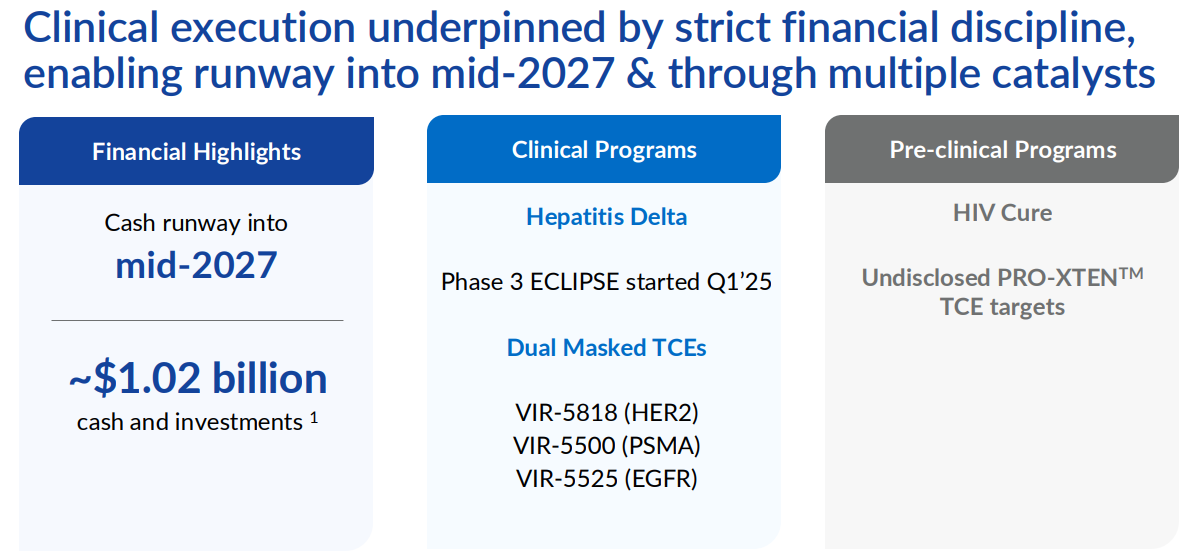 | 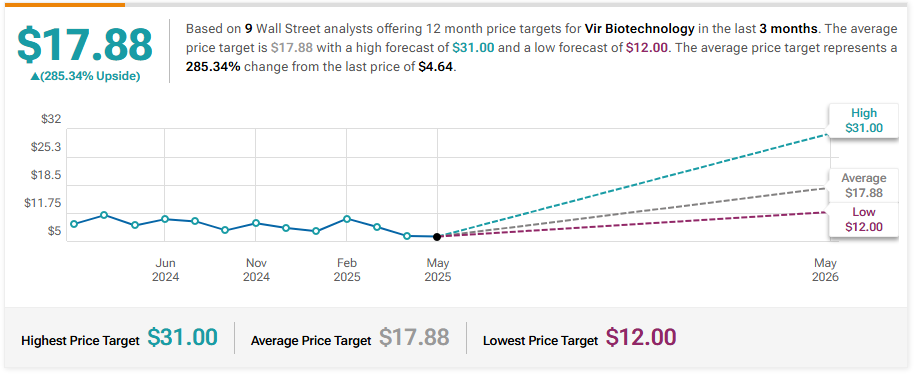 | Needham Maintains Buy on Vir Biotechnology, Lowers Price Target to $14
Goldman Sachs Maintains Buy on Vir Biotechnology, Lowers Price Target to $21
Barclays Maintains Overweight on Vir Biotechnology, Raises Price Target to $31
HC Wainwright & Co. Reiterates Buy on Vir Biotechnology, Maintains $110 Price Target | 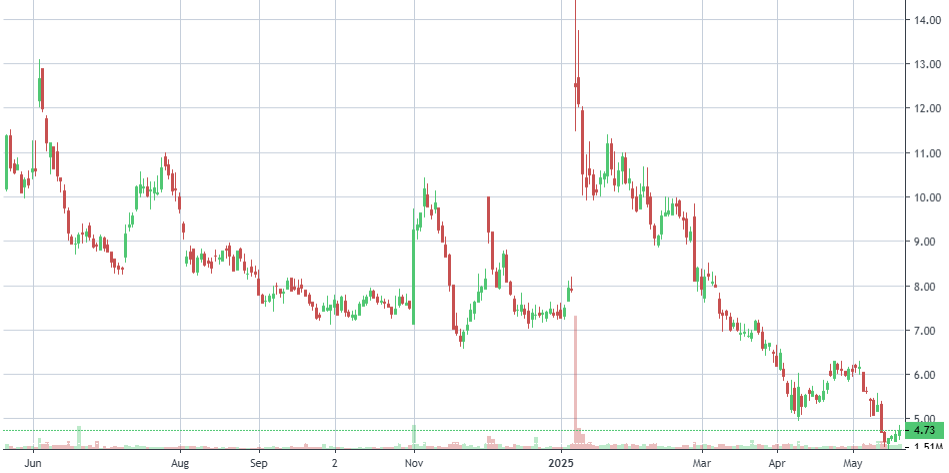 | | | Company: Blade Air Mobility, Inc.
Quote: $BLDE
BT: $3-$4
ST: $8
Sharks Opinion:
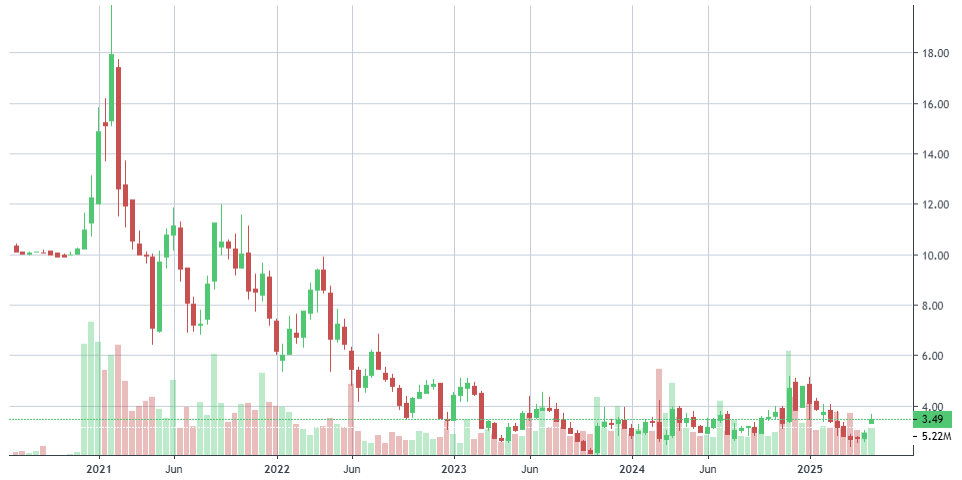
Blade is a name we’ve traded in the past, but like many pandemic-era mobility plays, it has struggled to maintain investor interest in recent years.
While the company has made steady progress expanding its core business, the most notable development has been its strategic pivot toward medical transport — now the company’s largest revenue segment, surpassing traditional passenger services.
This shift has added a layer of stability to Blade’s business model, especially as passenger demand has softened in the wake of publicized helicopter accidents and growing consumer caution around airborne transport.
From a valuation perspective, Blade currently trades roughly in line with its full-year revenue, suggesting the potential for upside should investors begin assigning a meaningful multiple to its diversified service lines. However, until trading volume improves and investor interest returns, the stock is likely to remain range-bound in the near term.
For now, Blade’s operational evolution is encouraging — but the market may need a clearer profitability path, renewed volume, or a strategic catalyst before the stock can break out of its current holding pattern.
Description: Blade Air Mobility, Inc. provides air transportation and logistics services for hospitals in the United States and internationally. The company operates in Passenger and Medical segments. It operates helicopter and amphibious seaplane flights in the United States and Europe; offers non-medical jet charter services; and transports human organs for transplant and/or the medical teams, as well as offers donor logistics coordination and support services. The company was founded in 2014 and is headquartered in New York, New York. | | | 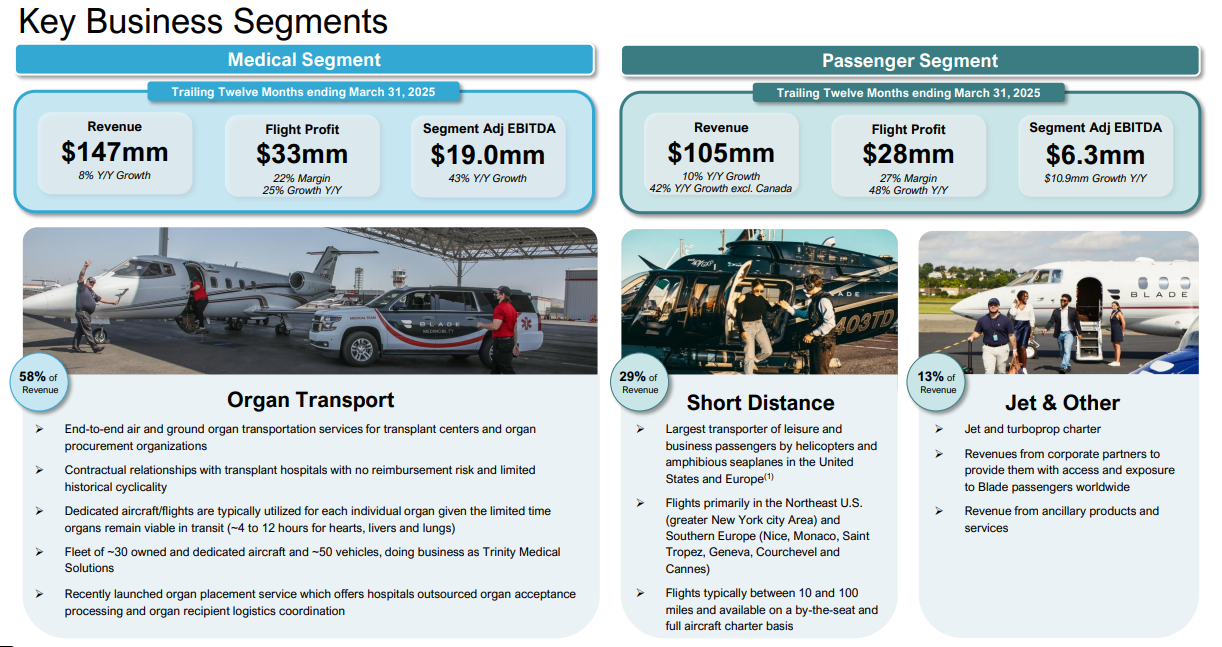 | Blade Air Mobility reported strong financial results for FY 2024, with total revenue reaching $249 million, a 10% year-over-year increase. Most notably, the company achieved its first full year of positive adjusted EBITDA, a year-over-year improvement of $17.8 million — a key milestone on its path toward sustainable profitability.
Q1 2025 Snapshot: Continued Growth Momentum
For the first quarter of 2025, Blade reported $54 million in revenue, reflecting a 10% year-over-year increase when excluding discontinued operations in Canada. On a trailing twelve-month (TTM) basis, revenue climbed to $251 million, up from $216 million in the prior-year period. TTM adjusted EBITDA improved from a $7 million loss in Q1 2023 to a $4 million gain in Q1 2025 — further confirming operational leverage as the company scales.
Medical Segment: Core Growth Engine
Blade’s Medical segment continues to drive the business, contributing 58% of total revenue. Over the trailing twelve months, the segment generated: $147 million in revenue (+8% YoY) $19 million in adjusted EBITDA (+43% YoY) 22% flight profit margin
The medical transport business primarily supports organ transplant logistics, serving transplant centers and organ procurement organizations with approximately 30 aircraft and 50 ground vehicles. Blade currently covers just 30% of a $1 billion addressable market in U.S. transplant air logistics — presenting meaningful room for expansion.
Passenger Segment: Stabilizing With Improved Margins
The Passenger segment also showed solid year-over-year growth: $105 million in TTM revenue (+10% YoY, +42% excluding Canada) $6.3 million in segment adjusted EBITDA (+10.9% YoY) 27% flight profit margin, reflecting 48% YoY improvement
These gains suggest Blade’s consumer-facing business is stabilizing and benefitting from operational refinements — particularly in cost controls and route efficiency. | 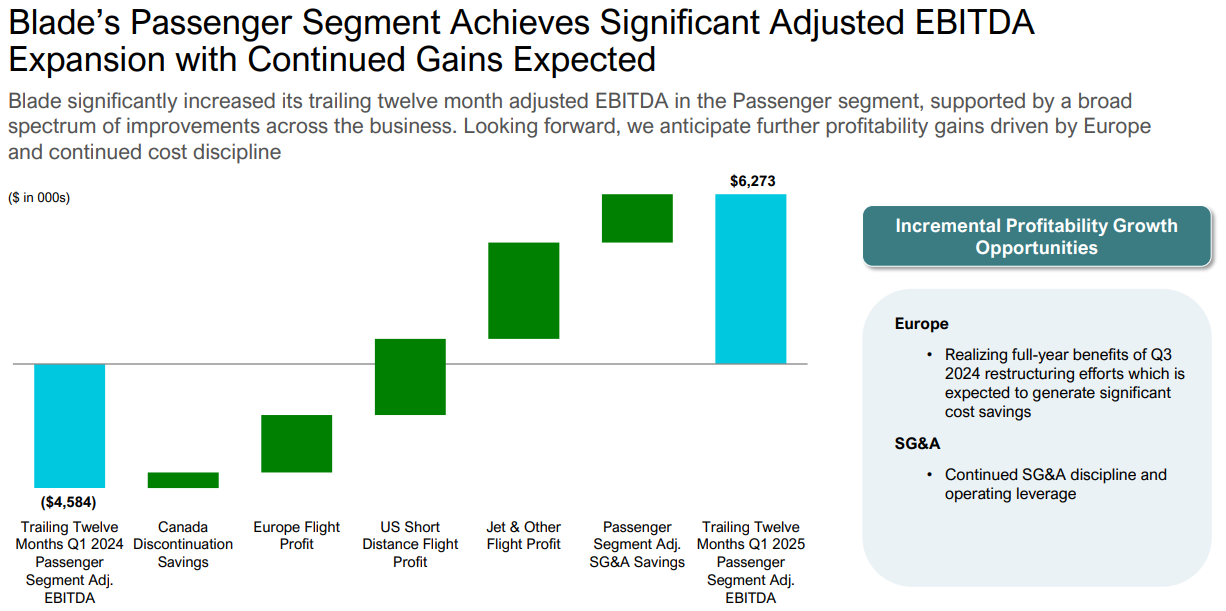 | 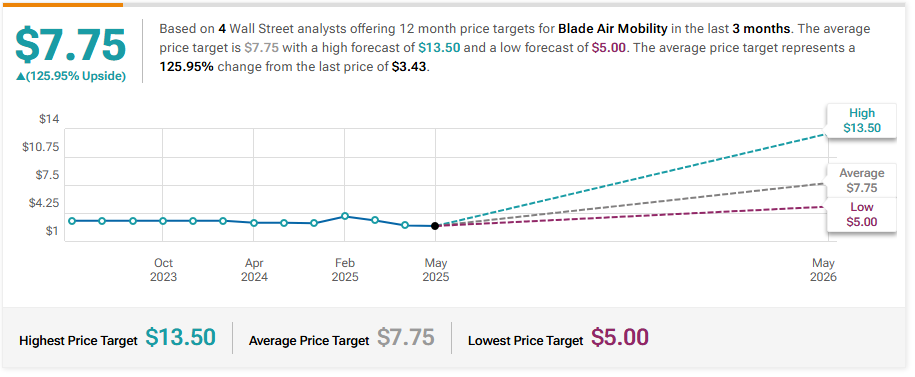 | Lake Street Initiates Coverage On Blade Air Mobility with Buy Rating, Announces Price Target of $6.5
JP Morgan Maintains Overweight on Blade Air Mobility, Raises Price Target to $6
Citigroup Maintains Buy on Blade Air Mobility, Lowers Price Target to $8
Credit Suisse Maintains Outperform on Blade Air Mobility, Lowers Price Target to $7
|  | | | Company: AST SpaceMobile, Inc
Quote: $ASTS
BT: N/A
ST: Bear Case $15 Bull Case $35 +
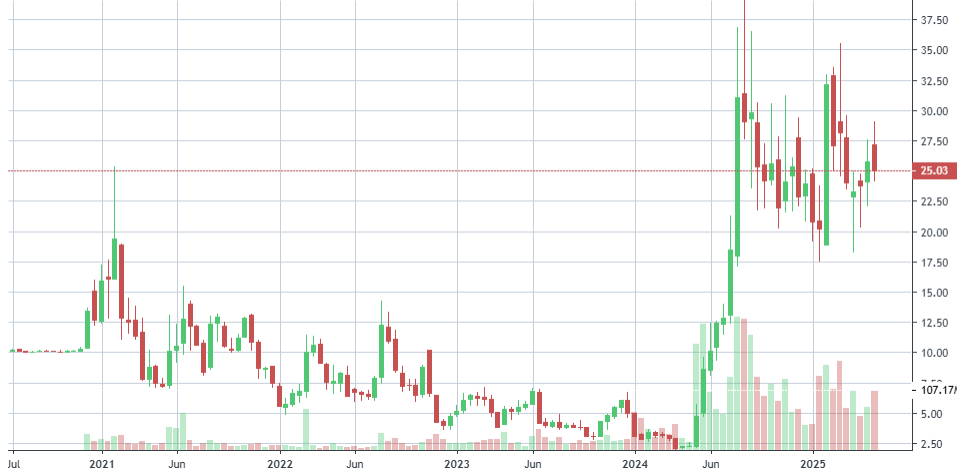
Sharks Opinion: AST SpaceMobile is a name we’ve followed since its initial listing, though we’ve historically taken a cautious stance given its early-stage profile — opting instead for a more mature play like Telesat (TSAT). While TSAT delivered respectable gains, they pale in comparison to ASTS’s performance, even as the company remains pre-revenue and unprofitable.
That said, ASTS’s strategic partnerships and execution milestones are increasingly difficult to ignore.
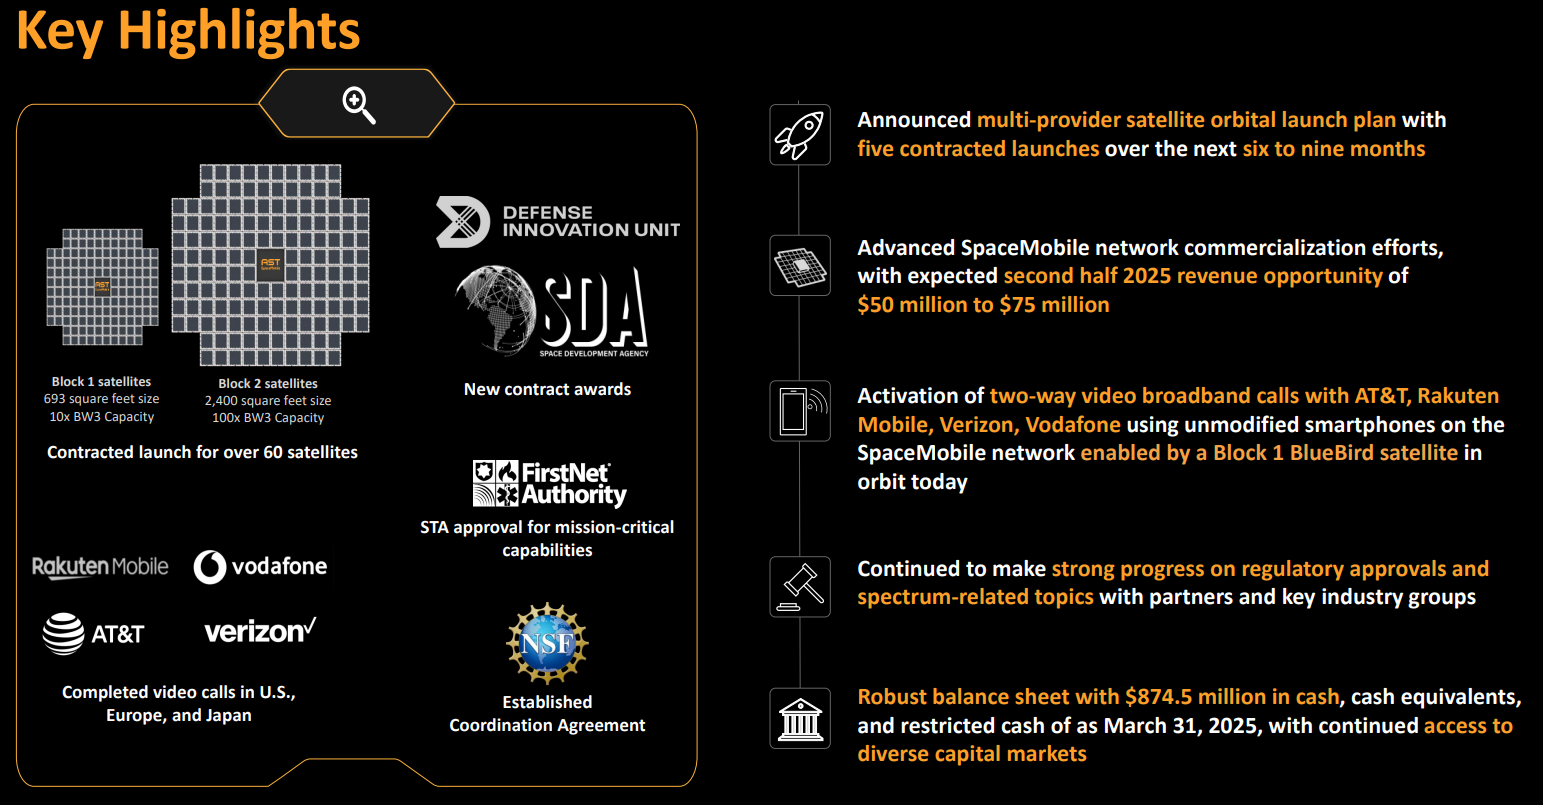
The company has six satellites in orbit and plans to scale rapidly, targeting 60 satellites by the end of 2026. Backed by vertically integrated manufacturing with capacity for six satellites per month, ASTS intends to begin monthly launch cycles by July 2025.
Critically, ASTS has secured major telecom partnerships with AT&T, Vodafone, and Rakuten, and now holds over 40 mobile network operator agreements covering a combined 2.4 billion subscribers. This validates its core thesis: direct-to-device satellite coverage that extends mobile connectivity where traditional infrastructure falls short.
The next few quarters will be pivotal. If ASTS successfully launches commercial services and achieves early user adoption, it could quickly evolve from a speculative bet into a disruptive force in global satellite communications.
Description: AST SpaceMobile, Inc., together with its subsidiaries, designs and develops the constellation of BlueBird satellites in the United States. The company provides a cellular broadband network in space to be accessible directly by smartphones for commercial use and other applications, as well as for government use. Its SpaceMobile service provides cellular broadband services to end-users who are out of terrestrial cellular coverage. The company was founded in 2017 and is headquartered in Midland, Texas. | | | 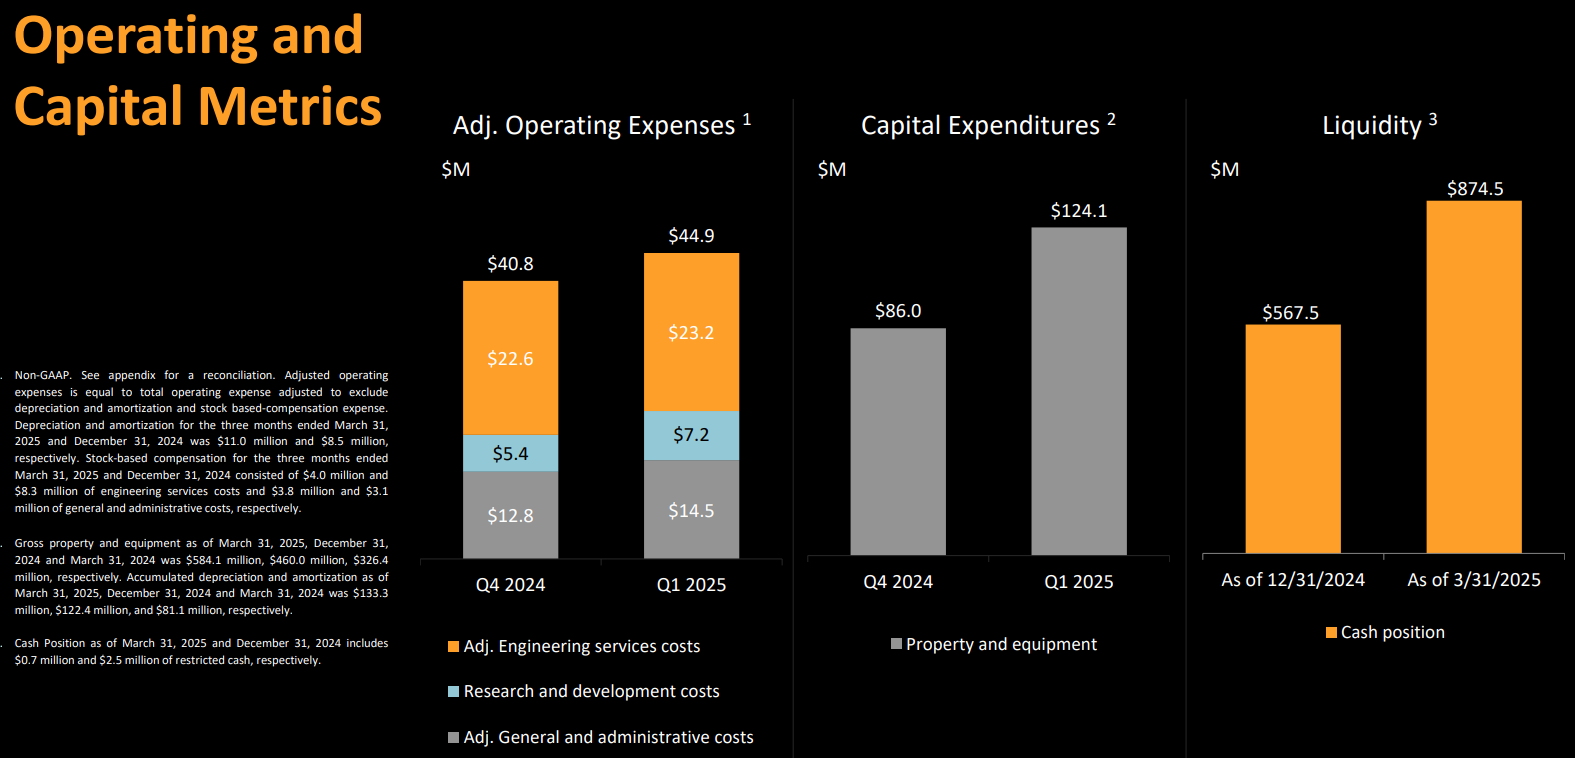 | AST SpaceMobile is building what it claims to be the world’s first space-based cellular broadband network, designed to deliver direct-to-device (D2D) connectivity using standard smartphones — no specialized hardware required. After more than $1 billion in investment and seven years of development, the company has successfully launched its first five BlueBird satellites and is preparing for broader commercial deployment.
The company’s core value proposition — global mobile coverage without terrestrial infrastructure — has attracted attention from major telecom players. Notably, SpaceX’s Starlink is also working with T-Mobile (NASDAQ: TMUS) on D2D capabilities, underscoring the growing competition and commercial potential in this emerging frontier.
Major Strategic Partnerships Validating the Model
Before deploying its first constellation, AST SpaceMobile secured a robust slate of commercial agreements: AT&T: Six-year agreement with a $20 million revenue commitment Verizon: Committed $100 million in contracts and equity investment Vodafone: Joint venture (SatCo) to provide full mobile coverage across Europe, backed by a $25 million revenue commitment and equity stake Alphabet (Google) also invested in the company alongside Vodafone In total, AST has signed agreements with over 45 mobile network operators (MNOs), including industry leaders such as Rakuten Mobile, Bell Canada, Orange, Telefónica, TIM, MTN, Zain, STC, Globe Telecom, and Liberty Latin America, collectively representing access to billions of global subscribers.
Financials: Progress Over Profit as Commercialization Nears
In Q1, ASTS reported modest revenue of $0.6 million, primarily from gateway sales and government milestones. The company remains in pre-commercial development, with full service launch anticipated by late 2025.
Operating losses widened to $63.6 million, reflecting increased R&D and satellite production costs. However, the company’s balance sheet remains well-capitalized, bolstered by a $460 million convertible note issuance, a $55 million equity raise, and a cash position of $874 million, providing sufficient runway through at least 2025.
Growth Outlook: From Zero to Scale in 24 Months
ASTS is entering an inflection point. After years of technical validation and strategic alignment, the company is now positioned for meaningful top-line acceleration: 2024 sales forecast: $59 million (up 1,200% from $4.4 million in 2023) 2025 analyst consensus: $275+ million in revenue (a further 370% increase) If execution remains on track and user adoption follows commercial deployment, AST SpaceMobile could emerge as a disruptive force in global telecom infrastructure, providing true mobile connectivity to previously unreachable geographies.
|  | 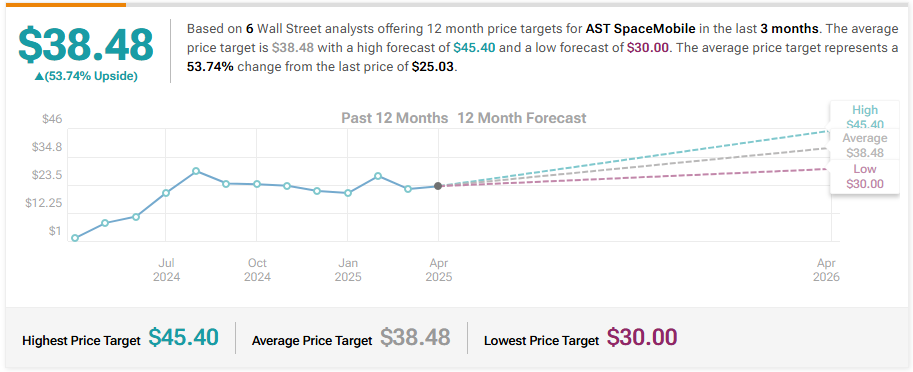 | Scotiabank Maintains Sector Outperform on AST SpaceMobile, Lowers Price Target to $45.4
UBS Maintains Buy on AST SpaceMobile, Raises Price Target to $38
Cantor Fitzgerald Reiterates Overweight on AST SpaceMobile, Maintains $30 Price Target
|  | | | © Copyright, 2024, info@stocksharksresearch.com
This newsletter is sent to you, because you are a customer or subscriber of Stocks | | | This material has been prepared by a sales or trading employee or agent of StockSharks Inc. and is, or is in the nature of, a solicitation. This material is not a research report prepared by StockSharks Research Department. By accepting this communication, you agree that you are an experienced user of the futures markets & Stock market, capable of making independent trading decisions, and agree that you are not, and will not, rely solely on this communication in making trading decisions. DISTRIBUTION IN SOME JURISDICTIONS MAY BE PROHIBITED OR RESTRICTED BY LAW. PERSONS IN POSSESSION OF THIS COMMUNICATION INDIRECTLY SHOULD INFORM THEMSELVES ABOUT AND OBSERVE ANY SUCH PROHIBITION OR RESTRICTIONS. TO THE EXTENT THAT YOU HAVE RECEIVED THIS COMMUNICATION INDIRECTLY AND SOLICITATIONS ARE PROHIBITED IN YOUR JURISDICTION WITHOUT REGISTRATION, THE MARKET COMMENTARY IN THIS COMMUNICATION SHOULD NOT BE CONSIDERED A SOLICITATION. The risk of loss in trading futures and/or options is substantial and each investor and/or trader must consider whether this is a suitable investment. Past performance, whether actual or indicated by simulated historical tests of strategies, is not indicative of future results. Trading advice is based on information taken from trades and statistical services and other sources that StockSharks Inc. believes are reliable. We do not guarantee that such information is accurate or complete and it should not be relied upon as such. Trading advice reflects our good faith judgment at a specific time and is subject to change without notice. There is no guarantee that the advice we give will result in profitable trades. | | | | |