In times of extreme market stress, I deliberately choose not to be swept away by media noise. Instead, I devote my energy to analyzing data and contextualizing it within a framework that is both rigorous and well-tested. Here is what that framework tells us about the current turbulence: As of Friday, April 4, well-diversified portfolios were still within the range of what I would classify as "normal market fluctuations" — the kind that can occur at any point in a typical market cycle. Yet, if you read the headlines, you would have thought we were in full-blown apocalypse mode. By Monday, April 7, however, we crossed into what the model defines as "turbulence" — a condition with a 33% probability of occurring over a given time frame. The model's most extreme scenario, "armageddon" — which has less than a 5% probability — has not yet occurred.
Will it happen? The honest answer is: I don’t know. And no one can say for sure. Be cautious of anyone who claims otherwise. Markets are complex systems, and analytical humility is essential. What we can do is implement strategies that help maximize the probability of protecting and growing our wealth. These include: Defining and adhering to an Investment Policy Statement (IPS): a guiding document that outlines your objectives, time horizon, risk tolerance, and portfolio management criteria. A true "compass" for navigating uncertainty. Building a sound asset allocation, based on rational assumptions and aligned with long-term goals. Implementing true diversification, which goes beyond merely counting holdings and considers actual asset correlations. Practicing continuous risk management, with both ex-ante and ex-post analysis tools. Maintaining behavioral discipline, avoiding emotional reactions driven by panic or euphoria.
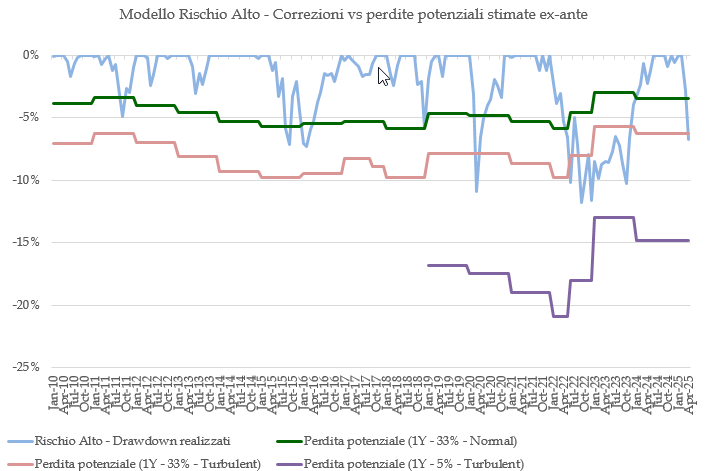
As I wrap up this newsletter, the FTSE MIB is up +1.46%, and S&P 500 futures are up +1.70%. 📩 I’ll be back with another update at the end of the week. And in my upcoming quarterly newsletter, I’ll walk you through my full risk analysis and asset allocation framework. If you prefer not to wait and would like to discuss things more in depth, don’t hesitate to get in touch. Stay tuned. Stay well informed. ***************************************************** The chart below shows the cumulative drawdowns (blue line) of the High-Risk Multi-Asset Model from 2010 to the present. For 2025, the portfolio allocation is as follows: The current drawdown stands at 6.7%.The colored lines in the chart represent ex-ante risk analysis — that is, the projected maximum losses the model might face during any given year under various market conditions: The green line reflects a "normal" market scenario The pink line represents a "turbulent" market The purple line indicates an "armageddon" scenario
As of April 7, the drawdown has reached exactly the turbulence threshold forecasted by the model. |